Download
1 / 1
10 likes | 119 Vues
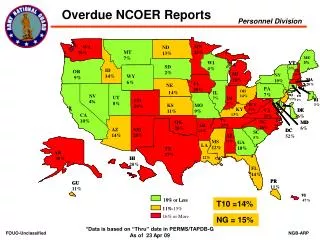
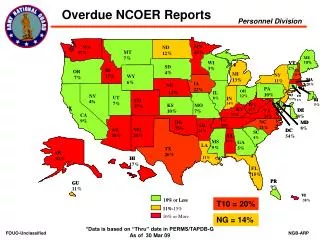
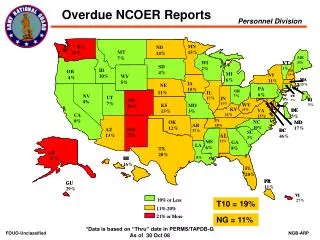
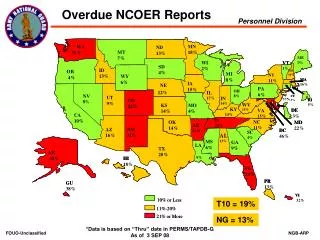
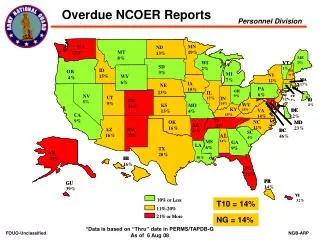
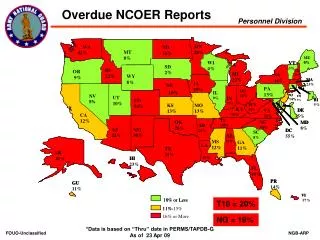
This report provides a comprehensive overview of military data distribution across various states in the U.S. The percentages reflect the reporting rates in relation to overdue Non-Commissioned Officer Evaluation Reports (NCOER) as of April 23, 2009. It highlights state-specific percentages, revealing insights into military reporting trends and discrepancies across regions. The analysis aims to inform military administrative decisions and enhance reporting effectiveness within different states.

E N D
MN MN WA WA ND ND MT MT 28% 53% 42% 47% 30% 16% 46% 8% ME ME WI WI VT VT 6% 16% SD SD 10% 4% 29% 3% ID ID OR OR NH NH 39% 2% MI MI NY NY 36% 26% 40% 22% WY WY 9% 34% 22% 23% MA MA 28% 16% 8% 53% IA IA 23% NE NE PA PA 29% 34% 35% OH OH IL IL 25% 13% NV NV NJ NJ 25% 18% CT CT UT UT IN IN 9% 24% 14% RI RI CO CO 3% 5% 53% 10% 32% 17% 17% WV WV 5% KS KS MO MO 51% 34% KY KY DE DE VA VA 34% 32% 38% 13% 16% 13% CA CA 49% 18% 5% 29% 28% . . TN TN 12% 55% NC NC OK OK MD MD AR AR 45% 30% 30% 38% 21% 28% 8% AZ AZ NM NM DC DC 25% 42% SC SC AL AL 21% 17% 30% 20% 55% 8% 11% MS MS 28% 40% GA GA LA LA 12% 11% 11% 56% TX TX AK AK 49% 31% 16% 52% HI HI 41% 33% 23% FL FL 19% 42% PR PR GU GU 14% 11% VI VI 10% or Less 10% or Less 57% 11% 11% - - 15% 16% or More Overdue NCOER Reports 16% T10 = 20% NG = 19% *Data is based on “Thru” date in PERMS/TAPDB-G As of 23 Apr 09