Unlocking Library Insights: Patron Behavior Analysis
290 likes | 407 Vues
Discover how to understand your community better through analyzing patron behavior in this engaging presentation by Joan Frye Williams. Learn to identify relationships between patron groups and specific services, utilize behavioral indicators, and create patron interest groups. Gain valuable insights on service usage, typical transactions, service locations, and timing. Enhance your library's outreach, policies, and resource planning by leveraging key measurements that matter the most. Don't miss this opportunity to optimize your library's effectiveness!

Unlocking Library Insights: Patron Behavior Analysis
E N D
Presentation Transcript
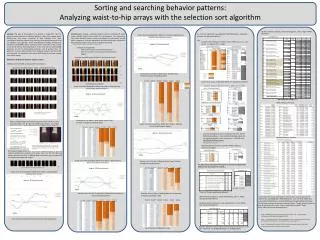
Measurements that Matter: Analyzing Patron Behavior Presented by Joan Frye Williams Tuesday, March 4, 2014
Your mission: Understand your community better so you can respond and prepare
Look for relationships between patron groups and use of specific services
As long as you’re looking at groups, you’re not breaching confidentiality
Set up patron groups forknown behavioral indicators • Age range • Examples: 0-5, 40-49, under 30 • Include birthdate or birth year in patron record • Tenure as a cardholder • Examples: 0-6 months, first year, 10+ years • Include date of first registration in patron record • Membership in a specific constituency • Examples: friends, donors, volunteers • Include flags for these affiliations in patron record
Encourage patrons to opt into other pre-defined interest groups • Subject or genre • Service or program type • Format or medium • Preferred communications channel
Create ad hoc patron groups based on specific behaviors Example: Create a group of patrons who checked out graphic novels this month. Then see how often that group downloads e-books.
1. Who uses each service? • Total transactions • Number and % breakdown of transactions by patron group • Total unique users • Number and % breakdown of unique users by patron group
Knowing who’s using each service can tell you • “Niche” vs. broad appeal • How many people/which groups will be affected by change or discontinuation • Which groups to target with outreach or advertising • Which services are starting to “age out”
2. What is a “typical” transaction for patrons in different groups?
You don’t have to be a math wiz to know what’s going on, but…
One simple math concept can help you get a better picture of typical use for any library service
Most libraries calculate average (mean) usage • 100 patrons borrowed 2 items each • 20 patrons borrowed 10 items each • 4 patrons borrowed 50 items each Total items borrowed = 600 Divided by total patrons = 124 Average (mean) number of items checked out = 4.8
Try calculating the mode instead The mode is the number that occurs most often http://www.mathsisfun.com/mode.html • 100 patrons borrowed 2 items each • 20 patrons borrowed 10 items each • 4 patrons borrowed 50 items each Typical number of items checked out (mode) = 2 i.e. the most frequently occurring situation
Knowing how patrons typically use a service can tell you • Where to draw the line for policies and limits • Whether one size fits all or to tailor for different groups • How to estimate minimum resources required to provide a specific service to a specific population
3. Where is the service being used? • Total transactions • Number and % breakdown of transactions at each location – facility, floor, service desk, workstation ID, IP address • Number and % breakdown of transactions by each patron group for each location
Knowing where a service is used can tell you • How to allocate space to match demand • How to co-locate services for a target group • How different groups move through your buildings • Which virtual transactions are done by patrons and which by staff on behalf of patrons
4. When is the service being used? • Total transactions • Number and % breakdown of transactions by month, day of the week, hour of the day • For virtual transactions, number and % breakdown of transactions during library building open hours and during closed hours • Number and % breakdown of transactions by each patron group for each day, hour
Knowing when a service is usedcan tell you • How to avoid scheduling incompatible groups • Which services might be corralled into specific “drop in” hours • Whether a specific event correlates with increased library usage by target patron groups • How virtual services affect in-building workload
joan@jfwilliams.com Let’s continue the conversation… Photo by Martin Helmke
Infopeople webinars are supported in part by the U.S. Institute of Museum and Library Services under the provisions of the Library Services and Technology Act, administered in California by the State Librarian. This material is licensed under a Creative Commons 3.0 Share & Share-Alike license. Use of this material should credit the author and funding source.