Download
1 / 1
10 likes | 258 Vues
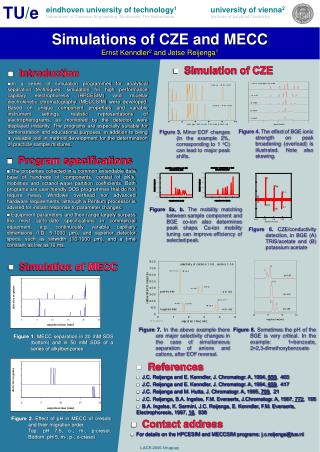
Figure 7 . In the above example there are major selectivity changes in the case of simultaneous separation of anions and cations, after EOF reversal. Figure 8. Sometimes the pH of the BGE is very critical. In the example: 1=benzoate, 2=2,3-dimethoxybenzoate. TU / e.

E N D
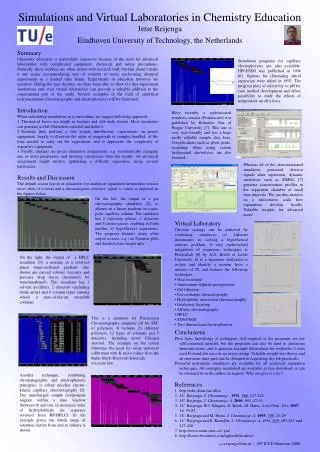
Figure 7.In the above example there are major selectivity changes in the case of simultaneous separation of anions and cations, after EOF reversal. Figure 8.Sometimes the pH of the BGE is very critical. In the example: 1=benzoate, 2=2,3-dimethoxybenzoate TU/e eindhoven university of technology1 Department of Chemical Engineering, Eindhoven, The Netherlands university of vienna2 Institute of Aalytical Chemistry Simulations of CZE and MECCErnst Kenndler2 and Jetse Reijenga1 • Simulation of CZE • Introduction • In a series of simulation programmes for analytical separation techniques, simulators for high performance capillary electrophoresis (HPCESIM) and micellar electrokinetic chromatography (MECCSIM) were developed. Based on unique component properties and variable instrument settings, realistic representations of electropherograms, as monitored by the detector, were displayed instantly. The programs are especially suitable for demonstration and educational purposes, in addition to being a valuable tool in method development for the determination of practicle sample mixtures. Figure 4.The effect of BGE ionic strength on peak broadening (overload) is illustrated. Note also skewing. Figure 3. Minor EOF changes (in the example 2%, corresponding to 1 oC) can lead to major peak shifts. • Program specifications • The properties collected in a common extendable data base of hundreds of components, consist of pK’s, mobilities and octanol-water partition coefficients. Both programs are user-friendly DOS programmes that do not require heavy Windows overhead nor advanced hardware requirements, although a Pentium processor is advised for instant response to parameter changes. • Equipment parameters and their range largely surpass the most up-to-date specifications in commercial equipment, e.g. continuously variable capillary dimensions (I.D. 5-1000 μm), and superior detector specs, such as slitwidth (10-1000 μm), and a time constant as low as 10 ms. Figure 5a, b.The mobility matching between sample component and BGE co-ion also determines peak shape. Co-ion mobility tuning can improve efficiency of selected peak. Figure 6. CZE/conductivity detection, in BGE (A) TRIS/acetate and (B) potassium acetate • Simulation of MECC Figure 1.MECC separation in 20 mM SDS (bottom) and in 50 mM SDS of a series of alkylbenzenes • References • J.C. Reijenga and E. Kenndler, J. Chromatogr. A, 1994, 659, 403 • J.C. Reijenga and E. Kenndler, J. Chromatogr. A, 1994, 659, 417 • J.C. Reijenga and M. Hutta, J. Chromatogr. A, 1995, 709, 21 • J.C. Reijenga, B.A. Ingelse, F.M. Everaerts, J.Chromatogr. A, 1997, 772, 195 • B.A. Ingelse, K. Sarmini, J.C. Reijenga, E. Kenndler, F.M. Everaerts, Electrophoresis, 1997, 18, 938 Figure 2. Effect of pH in MECC of cresols and their migration order. Top: pH 7.5, o-, m-, p-cresol, Bottom: pH 5, m-, p-, o-cresol • Contact address • For details on the HPCESIM and MECCSIM programs: j.c.reijenga@tue.nl LACE-2000 Uruguay