Download
1 / 1
10 likes | 217 Vues
Simulations and Virtual Laboratories in Chemistry Education Jetse Reijenga Eindhoven University of Technology, the Netherlands. Summary

E N D
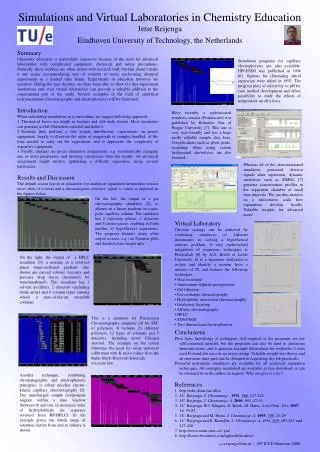
Simulations and Virtual Laboratories in Chemistry Education Jetse Reijenga Eindhoven University of Technology, the Netherlands • Summary • Chemistry education is particularly expensive because of the need for advanced laboratories with complicated equipment, chemicals and safety precautions. Naturally, these facilities are often shared with research staff, but that doesn’t make it any easier accommodating tens of students or more, performing identical experiments in a limited time frame. Experiments in education however are essential. During the past decades, we have been able to show [1] that experiment simulations and even virtual laboratories can provide a valuable addition to the experimental part of the study. Several examples in the field of analytical instrumentation (chromatography and electrophoresis) will be illustrated. • Introduction • When embedding simulations in a curriculum, we suggest following approach: • Theoretical basics are taught in lectures and self-study format. Most simulators can generate useful illustration material and demo’s. • Students then perform a few simple introductory experiments on preset equipment, largely to illustrate the order of magnitude of samples handled, of the time needed to carry out the experiment, and to appreciate the complexity of expensive equipment. • Finally, students are given simulation assignments, e.g. systematically changing one or more parameters, and drawing conclusions from the results. An advanced assignment might involve optimizing a difficult separation, using several parameters. • Results and Discussion • The default screen layout of simulators for analytical separation instruments consist most often of a menu and a chromatogram (detector signal vs. time) as depicted in the figures below. Simulation programs for capillary electrophoresis are also available. HPCESIM was published in 1994 [6]. Options for illustrating chiral separation were added in 1997. The program plots of selectivity vs pH for easy method development and offers possibility to study the effects of temperature on efficiency. More recently, a sophisticated windows version (Peakmaster) was published by Bohuslav Gas of Prague University [7]. This one is very user-friendly and has a huge easily editable sample data base. Complications such as ghost peaks, occurring when using certain background electrolytes, are also featured. Whereas all of the aforementioned simulators generated detector signals after separation, dynamic simulators such as SIMUL [7] generate concentration profiles in the separation chamber at small time intervals. We can thus monitor on a micrometer scale how separations develop locally. Valuable insights for advanced users! On the left, the output of a gas chromatography simulator [2], n-alkanes in a linear gradient on a non-polar capillary column. The simulator has 2 stationary phases, 2 detectors and 5 carrier gasses, enabling in finite number of hypothetical separations. The program features many other output screens, e.g. van Deemter plots and detailed plate height info. • Virtual Laboratory • Obvious synergy can be achieved by combining simulators of different instruments in solving a hypothetical analysis problem. A very sophisticated integration of numerous techniques is ProteinLab [8] by A.G. Booth of Leeds University. It is a simulator dedicated to isolate and identify a protein from a mixture of 20, and features the following techniques: • Heat treatment • Ammonium sulphate precipitation • Gel filtration • Ion-exchange chromatography • Hydrophobic interaction chromatography • Isoelectric focusing • Affinity chromatography • HPLC • SDS-PAGE • Two-dimensional electrophoresis On the right, the output of a HPLC simulator [3], a mixture in a reversed phase water-methanol gradient: also shown are curved solvent viscosity and pressure drop traces (maximum for water/methanol). This simulator has 2 solvent modifiers, 2 detectors (including diode array) and 6 column types (among which a state-of-the-art monolith column). This is a simulator for Permeation Chromatography simulator [4] for SEC of polymers. It includes 21 different polymers, 12 types of columns and 5 detectors, including novel Charged Aerosol. The example on the screen illustrates the need for using universal calibration with K and α values from the Kuhn-Mark-Houwink-Sakurada viscosity law. • Conclusions • Prior basic knowledge of techniques still required as the programs are not self-contained tutorials, but the programs can also be used in classroom demonstrations, and to generate example illustrations for textbooks. I even used ProteinLabs once in an exam setting. Valuable insight into theory and an enormous time-gain can be obtained in organizing dry-lab practicals. • Powerful instrument simulators are available for all analytical separation techniques. All examples mentioned are available as free download, or can be obtained from the author on request. Why not give it a try?! • References • http://edu.chem.tue.nl/ce • J.C. Reijenga, J. Chromatogr., 1991, 588, 217-224 • J.C. Reijenga, J. Chromatogr. A, 2000, 903, 47-54 • J.C. Reijenga, W.J. Kingma, D. Berek, M. Hutta, Acta Chim. Slov. 2007, 54, 79-87 • J.C. Reijenga and M. Hutta, J. Chromatogr. A, 1995, 709, 21-29 • J.C. Reijenga and E. Kenndler, J. Chromatogr. A, 1994, 659, 403-415 and 417-426. • http://www.natur.cuni.cz/~gas/ • http://home.btconnect.com/agbooth/archive/ Another technique, combining chromatographic and electrophoretic principles, is called micellar electro-kinetic capillary chromatography [5]. The (un)charged sample components migrate within a time window (between t0 and tm), in increased order of hydrophobicity (in sequence reversed from RP-HPLC). In the example given, the whole range of retention factors from zero to infinity is shown. j.c.reijenga@tue.nl - 20th ICCE Mauritius 2008