Download
1 / 30
300 likes | 325 Vues
Explore key statistical questions related to paleoclimate reconstruction methods for understanding global warming trends and projections. Investigate proxies like tree rings, ice cores, and corals, and address biases, correlations, and model uncertainties.

E N D
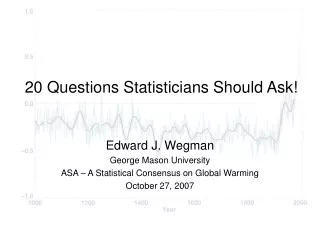
20 Questions Statisticians Should Ask! Edward J. Wegman George Mason University ASA – A Statistical Consensus on Global Warming October 27, 2007
Looking Backwards – Looking Forwards • Paleoclimate reconstruction uses proxies to estimate temperature profiles in the past. • Climate models use physical/statistical models usually based on PDEs to understand/predict/project temperature and other climate variables in the future. • Both have a fundamental statistical/stochastic character.
Paleoclimate Reconstruction After Bradley (1999)
Paleoclimate Reconstruction After Bradley and Eddy (1991)
Paleoclimate Reconstruction Confounding Factors? After Bradley and Eddy (1991)
Paleoclimate Reconstruction • climate field reconstruction (CFR) • principal component based (almost) • empirical orthogonal function analysis • data matrix columns are time series of proxy data • weighted to largest variance • climate plus scale (CPS) • simple averages of proxies
Paleoclimate Reconstruction • tree rings • tree ring size and density variations • best signal when trees are stressed • latitude and altitude • Precipitation and CO2 fertilization • ice cores • ice layer thickness • oxygen and hydrogen isotope balance • coral • annual growth • symbiosis with algae
TREE RINGS Paleoclimate Reconstruction
Paleoclimate Reconstruction Bristlecone Pines
Statistical Questions How were the 70 trees in NOAMER 1400 selected? • How representative are these trees of the population of trees that grew from 1400-2000? In terms of geography, altitude, and type. • If these trees seemed “interesting” to various individuals who took the core samples, should one believe those trees can/should be treated as a “random sample”? Are there biases in the selection of these trees? • Presumably many trees could not be sampled because they had died or been harvested. What is the effect of this “censoring” on the data (and the analysis)? • What is the correlation between temperature and tree ring growth?
Hockey Sticks Top Panel is original EOF (CFD) method applied to North American Tree Proxy, PC1. Bottom Panel is the result of the centered PCA.
Paleoclimate Reconstruction Ice Cores
Paleoclimate Reconstruction Lonnie Thompson’s Ice Cores and Nobel Laureate Al Gore
Paleoclimate Reconstruction 5. Similar questions exist about ice cores and how representative such data might be. What are the effects of gas diffusion in the ice core layers? 6. In the ice core (Vostok) data that Al Gore illustrates in the Inconvenient Truth, the temperature time series leads, not lags, the CO2 time series by 800 to 1000 years. What is the causal mechanism? It would seem that temperature increases cause CO2 release, not vice versa. The common answer is that there is an (unspecified) feedback mechanism.
Paleoclimate Reconstruction Corals
Two Mode Proxy-Paper Network Most Common Proxies
Paleoclimate Reconstruction • Why are the same proxies used in so many papers? Most recently, Osborn and Briffa (2006), D’Arrigo et al. (2006), Juckes et al. (2007). Mann et al. (1998, 1999) was ground breaking in using hundreds of proxies. Most more recent papers focus on the top 15 or so in our two-mode network. Are they chosen because they show the “hockey stick” and those omitted don’t?
Statistical Questions • What calibration studies have been performed? Rescaling steps seem to suggest that the correlation must be near 100%. Is that the case? How are the confounding variables removed? • The temperature proxy search is a regression problem. Why should one choose to use principal components (not appropriate for finding a nonstationary mean)? • What weights are used to combine different proxy types? Why? • If the data are not a random sample, then what confidence can be given to any modeling and to any “error bars”? Why pointwise confidence intervals in place of confidence bands? Is new theory needed?
Statistical Questions • Most models are deterministic, estimating the expected temperature or other component. To what extent are these models chaotic systems? How thoroughly has this been investigated? • For coupled ocean-atmosphere-land models, how much more likely is this to induce chaotic behavior? • Models depend on initial conditions often derived from remote sensing sources. How well calibrated to ground truth are these? • CO2 modeling shows a rapid increase in the near term. What do the models show in the longer term? • Given the apparent high correlation between CO2 and temperature in the model outputs, how direct is the link in the model itself?
Statistical Questions • What data should be collected that would be most cost-effective in increasing our understanding of the climatic models and the underlying physics (and statistics)? • Are all data valuable? How does one avoid the desire to collect data at sites that appear “interesting” beforehand?
Statistical Questions Melbourne’s Historic Weather Station – 1855 to 2007
Statistical Questions • To what extent have the micro-climates changed the instrumented temperature record? How have this effect been compensated for, especially in the absence of accurate records of original micro-climate? What is the impact of changing and improving technology? • How is the instrumented temperature record associated with the increase or decrease in the number of weather stations?
January Temp (observations) January Temp (GCM) Statistical Questions
Statistical Questions Bonus Question 21. Why to climate scientists show two side-by-side pictures and say look how well they compare? Subtract them and see how well they don’t compare.
Contact Information Where to send climate police: Edward J. Wegman Department of Computational and Data Sciences George Mason University Fairfax, VA 22030 Email: ewegman@gmail.com