3.2 Graphs of Functions
130 likes | 357 Vues
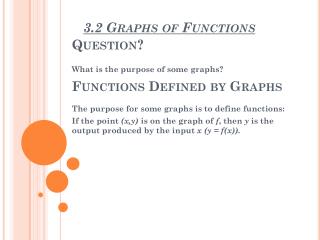
Question?. Functions Defined by Graphs. What is the purpose of some graphs?. The purpose for some graphs is to define functions: If the point ( x,y ) is on the graph of f , then y is the output produced by the input x (y = f(x)). 3.2 Graphs of Functions.

3.2 Graphs of Functions
E N D
Presentation Transcript
Question? Functions Defined by Graphs What is the purpose of some graphs? The purpose for some graphs is to define functions: If the point (x,y) is on the graph of f, then y is the output produced by the input x(y = f(x)). 3.2 Graphs of Functions
Example 1: A function defined by a graph • Determine the following • A. f(0) B. f(3) • C. The domain of f D. The range of f
The Vertical Line Test: Sound Familiar? • Firstly, what is the equation of a vertical line? • Test: By drawing a vertical line though a graph we will be able to determine if the graph represents a function. • How so? The Vertical Line Test • A Graph represents a function if and only if no vertical line intersects the graph more than once Example 2:
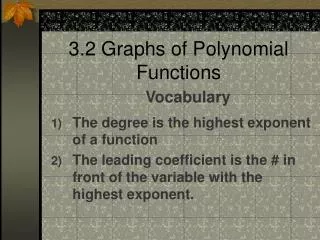
Analyzing Graphs:What are the most important parts of a graph? • x- and y-intercepts • Intervals of increase or decrease • local maxima and minima • Intervals of concavity (concave up or down)
Increasing And Decreasing Functions • Graph is always rising, falling, or constant as you move from left to right along the x-axis. Example 3: • On what intervals is the function increasing, decreasing, or constant?
Local Maxima • A function f has a local maximum at x = c if the graph has a peak at the point ( c, f(c) ) • Conclusion? • f(x)≤f(c) for all x near c. (English translation please) Local Minima • A function f has a local minimum at x = d if the graph has a valley at the point ( d, f(d) ) • Conclusion? • f(x)≥f(d) for all x near d. (*Calculus connection)
Concavity and Inflection Points • Concavity describes the way a curve bends. • Concave up or concave down? Test: • What is the purpose of the inflection point? • To determine the intervals between the different types of concavity
Ex5: The Absolute-Value Function Ex6: The Greatest Integer Function
3.2 Hmwr: 1-17 all (already assigned)New Hmwr (Need a graphing cal for 1st 5 qus)23, 29, 31, 33, 37, 41-53all, 60, 61