Download

1 / 28
1.16k likes | 2.41k Vues
Graphs of Trigonometric Functions. x. 0. cos x. 1. 0. -1. 0. 1. y = cos x. y. x. Graph of the Cosine Function. Cosine Function. To sketch the graph of y = cos x first locate the key points. These are the maximum points, the minimum points, and the intercepts.

E N D
x 0 cos x 1 0 -1 0 1 y = cos x y x Graph of the Cosine Function Cosine Function To sketch the graph of y = cos x first locate the key points.These are the maximum points, the minimum points, and the intercepts. Then, connect the points on the graph with a smooth curve that extends in both directions beyond the five points. A single cycle is called a period.
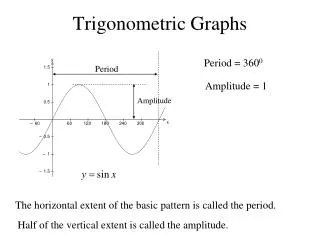
x 0 sin x 0 1 0 -1 0 y = sin x y x Graph of the Sine Function Sine Function To sketch the graph of y = sin x first locate the key points.These are the maximum points, the minimum points, and the intercepts. Then, connect the points on the graph with a smooth curve that extends in both directions beyond the five points. A single cycle is called a period.
2. The range is the set of y values such that . 5. Each function cycles through all the values of the range over an x-interval of . Properties of Sine and Cosine Functions Properties of Sine and Cosine Functions The graphs of y = sin x and y = cos x have similar properties: 1. The domain is the set of real numbers. 3. The maximum value is 1 and the minimum value is –1. 4. The graph is a smooth curve. 6. The cycle repeats itself indefinitely in both directions of thex-axis.
Key Steps in Graphing Sine and Cosine • Identify the key points of your basic graph • Find the new period (2π/b) • Find the new beginning (bx - c = 0) • Find the new end (bx - c = 2π) • Divide the new period into 4 equal parts to create new interval for the x values in key points • Adjust the y values of the key points by applying a and the vertical shift (d)
The graph y = sec x, use the identity . y Properties of y = sec x 1. domain : all real x x 4. vertical asymptotes: Graph of the Secant Function Secant Function At values of x for which cos x = 0, the secant function is undefined and its graph has vertical asymptotes. 2. range: (–,–1] [1, +) 3. period: 2
To graph y = csc x, use the identity . y Properties of y = csc x 1. domain : all real x x 4. vertical asymptotes: Graph of the Cosecant Function Cosecant Function At values of x for which sin x = 0, the cosecant functionis undefined and its graph has vertical asymptotes. 2. range: (–,–1] [1, +) 3. period: 2 where sine is zero.
Key Steps in Graphing Secant and Cosecant • Identify the key points of your reciprocal graph (sine/cosine), note the original zeros, maximums and minimums • Find the new period (2π/b) • Find the new beginning (bx - c = 0) • Find the new end (bx - c = 2π) • Find the new interval (new period / 4) to divide the new reference period into 4 equal parts to create new x values for the key points • Adjust the y values of the key points by applying the amplitude (a) and the vertical shift (d) • Using the original zeros, draw asymptotes, maximums become minimums, minimums become maximums… • Graph key points and connect the dots based upon known shape
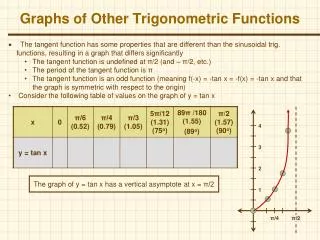
To graph y = tan x, use the identity . y Properties of y = tan x 1. domain : all real x x 4. vertical asymptotes: period: Graph of the Tangent Function At values of x for which cos x = 0, the tangent function is undefined and its graph has vertical asymptotes. 2. range: (–, +) 3. period:
y To graph y = cot x, use the identity . Properties of y = cot x x 1. domain : all real x 4. vertical asymptotes: vertical asymptotes Graph of the Cotangent Function Cotangent Function At values of x for which sin x = 0, the cotangent function is undefined and its graph has vertical asymptotes. 2. range: (–, +) 3. period:
Key Steps in Graphing Tan and Cot Identify the key points of your basic graph • Find the new period (π/b) • Find the new beginning (bx - c = 0) • Find the new end (bx - c = π) • Find the new interval (new period / 2) to divide the new reference period into 2 equal parts to create new x values for the key points • Adjust the y values of the key points by applying the amplitude (a) and the vertical shift (d) • Graph key points and connect the dots
y x 1.Chose the correct equation of the graph: a) y = sin x b) y = cos x c) y = –sin x d) y = –cos x
y x 2.Chose the correct equation of the graph: a) y = sin x b) y = cos x c) y = –sin xd) y = –cos x
y x 3. Chose the correct equation of the graph: a) y = sin ½ x b) y = 2 sin x c) y = sin 2x d) y = sin x
y x 4. Chose the correct equation of the graph: a) y = sin x + 1 b) y = cos x + 1 c) y = 2sin x d) y = 2cos x
y x 5. Chose the correct equation of the graph: a) y = sin x + 1 b) y = sin (x + π/2)c) y = sin (x – π/2)d) y = sin x
y x 6. Chose the correct equation of the graph: a) y = sin 4x b) y = 4 sin x c) y = sin x + 4 d) y = sin (x + 4)
y x 7. Chose the correct equation of the graph: a) y = sin ½ x b) y = 2 sin x c) y = sin 2x d) y = sin x
y x 8. Chose the correct equation of the graph: a) y = 4sin x b) y = 3 sin x + 1 c) y = sin 3x + 1 d) y = sin x + 4
y x Secant Function 9. Chose the correct equation of the graph: a) y = sec x b) y = csc x c) y = -sec x d) y = -csc x
y x Secant Function 10. Chose the correct equation of the graph: a) y = sec x b) y = 2sec x c) y = sec 2x d) y = sec x + 2
y x Secant Function 11. Chose the correct equation of the graph: a) y = sec x b) y = csc x c) y = -sec x d) y = -csc x
y x 12. Chose the correct equation of the graph: a) y = sec x b) y = csc x c) y = -sec x d) y = -csc x . Cosecant Function
y x 13. Chose the correct equation of the graph: a) y = csc x b) y = csc 2x c) y = 2csc x d) y = csc x – 2 . Cosecant Function
y x 14. Chose the correct equation of the graph: a) y = tan x b) y = cot x c) y = -tan x d) y = -cot x . Cotangent Function
y x period: 15. Chose the correct equation of the graph: a) y = tan x b) y = cot x c) y = -tan x d) y = -cot x .
y period: x 16. Chose the correct equation of the graph: a) y = 2tan x b) y = tan 2x c) y = -2cot x d) y = -cot 2x .