Download
1 / 8
80 likes | 204 Vues
Learn about the unique properties of tangent, cotangent, secant, and cosecant functions, their symmetries, vertical asymptotes, and graph variations. Explore examples to grasp their periodic nature and how to graph them effectively.

E N D
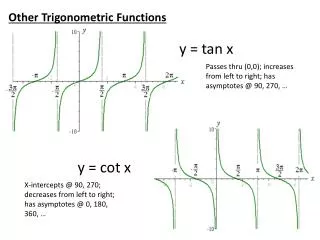
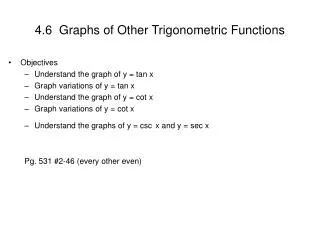
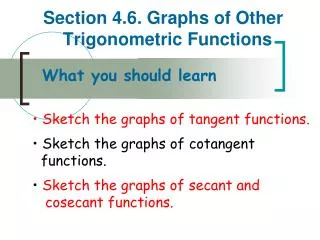
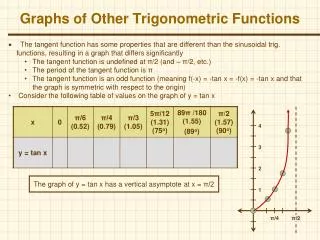
Graphs of Other Trigonometric Functions • The tangent function has some properties that are different than the sinusoidal trig. functions, resulting in a graph that differs significantly • The tangent function is undefined at π/2 (and – π/2, etc.) • The period of the tangent function is π • The tangent function is an odd function (meaning f(-x) = -tan x = -f(x) = -tan x and that the graph is symmetric with respect to the origin) • Consider the following table of values on the graph of y = tan x 4 3 2 The graph of y = tan x has a vertical asymptote at x = π/2 1 π/4 π/2
Graphs of Other Trigonometric Functions • The graph of y = tan x can be completed on the interval (– π/2, π/2) using the origin symmetry or by examining more points • Tangent curve characteristics • Period = π • Vertical Asymptotes occur at odd multiples of π / 2 • Odd function with origin symmetry • An x-intercept occurs midway between asymptotes • y-values of -1 and 1 occur halfway between x-intercept and asymptotes 2 1 π/2 -π/4 π/4 π/2 3π/4 π 5π/4 2π -1 -2
Graphs of Other Trigonometric Functions • We can use similar techniques as in the last section to look at variations of the tangent function graph y = A tan (Bx – C) • Find 2 consecutive vertical asymptotes (– < Bx – C < implies Bx – C = ____ and Bx – C = ____ • Identify x-intercept (halfway between asymptotes) • Find points on graph ¼ and ¾ of way between asymptotes (y-coordinates here should be –A and A, respectively) • Steps 1-3 graph one full period of the function (add additional cycles to right / left as needed) • Examples: Graph y = 3 tan 2x for – < x < -and- 2 full periods of y = tan (x –)
Graphs of Other Trigonometric Functions • The graph of y = cot x is similar to that of tan x but is completed on the interval (0, π) and is flipped vertically (moves down when going from left to right) • Cotangent curve characteristics • Period = π • Vertical Asymptotes occur at integralmultiples of π • Odd function with origin symmetry • An x-intercept occurs midway between asymptotes • y-values of -1 and 1 occur halfway between x-intercept and asymptotes 2 1 -π/4 π/4 π/2 3π/4 π -1 -2
Graphs of Other Trigonometric Functions • We can use similar techniques as in tangent to look at variations of the cotangent function graph y = A cot (Bx – C) • Find 2 consecutive vertical asymptotes (0 < Bx – C < π implies Bx – C = ____ and Bx – C = ____ • Identify x-intercept (halfway between asymptotes) • Find points on graph ¼ and ¾ of way between asymptotes (y-coordinates here should be –A and A, respectively) • Steps 1-3 graph one full period of the function (add additional cycles to right / left as needed) • Examples: Graph y = ½ cot x
Graphs of Other Trigonometric Functions • We can use the fact that csc x and sec x are the reciprocals of sin x and cos x to examine those graphs (using x-values of sin an cos, the corresponding y-values are simply the reciprocals of the y-values for sin and cos) • Consider the characteristics (notice the dashed red line indicating sin and cos)…
Graphs of Other Trigonometric Functions • We can use the graphs of sin x and cos x to help graph csc x and sec x • Example: Graph y = sin 2x and then graph its reciprocal function y = csc 2x • csc / sec curve characteristics • x-intercepts of sin (cos) curve correspond to vertical asymptotes of csc (sec) curve • maximum point on sin (cos) curve corresponds to minimum on csc (sec) curve • minimum point on sin (cos) curve corresponds to maximum on csc (sec) curve Example: Graph y = 2 sec 2x for – < x <
Graphs of Other Trigonometric Functions • Below are characteristics of the six basic trigonometry functions (review)…