Download
1 / 15
150 likes | 460 Vues
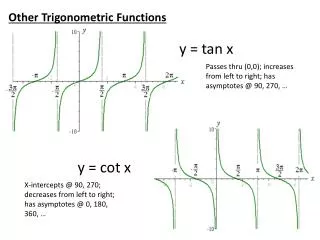
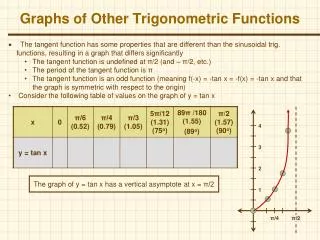
Graphs of Other Trigonometric Functions 4.6. The Tangent Curve: The Graph of y=tanx and Its Characteristics. y. Period: Domain: All real numbers except /2 + k , k an integer Range: All real numbers Symmetric with respect to the origin Vertical asymptotes at

E N D
The Tangent Curve: The Graph of y=tanx and Its Characteristics y Period: Domain: All real numbers except /2 + k , k an integer Range: All real numbers Symmetric with respect to the origin Vertical asymptotes at odd multiples of /2 1 –2 – 0 2 x 5 3 3 5 – – – 2 2 2 2 2 2 –1
y= A tan(Bx– C) Bx – C= /2 Bx – C = - /2 x-intercept between asymptotes 1. Find two consecutive asymptotes by setting the variable expression in the tangent equal to -/2 and /2 and solving Bx – C = -/2 and Bx – C = /2 2. Identify an x-intercept, midway between consecutive asymptotes. 3. Find the points on the graph 1/4 and 3/4 of the way between and x-intercept and the asymptotes. These points have y-coordinates of –A and A. 4. Use steps 1-3 to graph one full period of the function. Add additional cycles to the left or right as needed. Graphing y = A tan(Bx – C) x
Graph y = 2 tan x/2 for – < x < 3 Solution Step 1Find two consecutive asymptotes. Text Example Thus, two consecutive asymptotes occur at x = - and x = . Step 2Identify any x-intercepts, midway between consecutive asymptotes. Midway between x = - and x = is x = 0. An x-intercept is 0 and the graph passes through (0, 0).
y= 2 tanx/2 y 4 2 x -˝ ˝ 3˝ -2 -4 Solution Step 3Find points on the graph 1/4 and 1/4 of the way between an x-intercept and the asymptotes. These points have y-coordinates of –A and A. Because A, the coefficient of the tangent, is 2, these points have y-coordinates of -2 and 2. Text Example cont. Step 4Use steps 1-3 to graph one full period of the function. We use the two consecutive asymptotes, x = - and x = , an x-intercept of 0, and points midway between the x-intercept and asymptotes with y-coordinates of –2 and 2. We graph one full period of y = 2 tan x/2 from – to . In order to graph for – < x < 3 , we continue the pattern and extend the graph another full period on the right.
y 4 2 -2 -4 The Graph of y = cot x and Its Characteristics Characteristics Period: Domain: All real numbers except integral multiples of Range: All real numbers Vertical asymptotes: at integral multiples of n x-intercept occurs midway between each pair of consecutive asymptotes. Odd function with origin symmetry Points on the graph 1/4 and 3/4 of the way between consecutive asymptotes have y- coordinates of –1 and 1. The Cotangent Curve: The Graph of y = cotx and Its Characteristics x ˝ - 2 - /2 /2 3 /2
y= A cot(Bx– C) Bx – C= y-coord-inate is A. y-coord-inate is -A. x-intercept between asymptotes Bx – C = 0 1. Find two consecutive asymptotes by setting the variable expression in the cotangent equal to 0 and ˝ and solving Bx – C = 0 and Bx – C = 2. Identify an x-intercept, midway between consecutive asymptotes. 3. Find the points on the graph 1/4 and 3/4 of the way between an x-intercept and the asymptotes. These points have y-coordinates of –A and A. 4. Use steps 1-3 to graph one full period of the function. Add additional cycles to the left or right as needed. Graphing y=Acot(Bx-C) x
Graph y = 2 cot 3x Solution: 3x=0 and 3x= x=0 and x = /3 are vertical asymptotes An x-intercepts occurs between 0 and /3 so an x-intercepts is at (/6,0) The point on the graph midway between the asymptotes and intercept are /12 and 3/12. These points have y-coordinates of -A and A or -2 and 2 Graph one period and extend as needed Example
Example cont • Graph y = 2 cot 3x
The graph y = sec x, use the identity . y Properties of y = sec x 1. domain : all real x x 4. vertical asymptotes: Graph of the Secant Function Secant Function At values of x for which cos x = 0, the secant function is undefined and its graph has vertical asymptotes. 2. range: (–,–1] [1, +) 3. period:
To graph y = csc x, use the identity . y Properties of y = csc x 1. domain : all real x x 4. vertical asymptotes: Graph of the Cosecant Function Cosecant Function At values of x for which sin x = 0, the cosecant functionis undefined and its graph has vertical asymptotes. 2. range: (–,–1] [1, +) 3. period: where sine is zero.
y y 2 2 x x ˝ -˝ ˝ -2 -2 Text Example Use the graph of y = 2 sin 2x to obtain the graph of y = 2 csc 2x. Solution The x-intercepts of y = 2 sin 2x correspond to the vertical asymptotes of y = 2 csc 2x. Thus, we draw vertical asymptotes through the x-intercepts. Using the asymptotes as guides, we sketch the graph of y = 2 csc 2x.