Graphing Other Trigonometric Functions
Graphing Other Trigonometric Functions. Trigonometry, 5.0 Students know the definitions of the tangent and cotangent functions and can graph them. . Graphing Other Trigonometric Functions. Objective. Key Words. Graph tangent, cotangent, secant, and cosecant functions.

Graphing Other Trigonometric Functions
E N D
Presentation Transcript
Graphing Other Trigonometric Functions Trigonometry, 5.0 Students know the definitions of the tangent and cotangent functions and can graph them.
Graphing Other Trigonometric Functions Objective Key Words Graph tangent, cotangent, secant, and cosecant functions. Write equations of trigonometric functions Tangent Cotangent Secant Cosecant Domain Range X-intercept Y-intercept Asymptote
Quick Check How many completely whole apples do you have if you have 5/4 of an apple? So what is left? How many completely whole apples do you have if you have ½ of an apple? So what is left? How many completely whole apples do you have if you have 8 apples? So what is left? How would you express these three questions as an algebraic expression? (Hint: apples, pieces of apples)
Quick Check • Now think of π as the apple. • How many completely whole π do you have if you have 5/4 of an π? So what is left? • How many completely whole π do you have if you have ½ of an π? So what is left? • How many completely whole π do you have if you have 8 π? So what is left? • How would you express these three questions as an algebraic expression? (Hint: π, pieces of π known as remainder)
Before We Begin, Recall the Unit Circle: Trigonometric functions Reciprocal of Trigonometric functions What are these x and y values? Take out your unit circle to find out.
General Information you already know The summary of Transformations for the sinusoidal functions: and • The amplitude is • The period is • The horizontal shift is • The midline is • is the angular frequency; that is, the number of cycles completed in
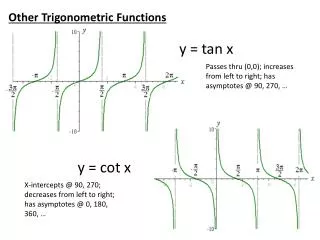
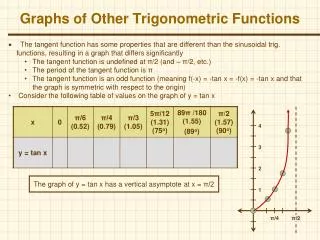
Example for Tangent of an Angle Find each value by referring to the graphs of the trigonometric functions. tan 11π/4 Since 11π/4 = 2 + 3π/4, Then tan 11π/4 = -1. You try: tan 7/2
1: Graph Cotangent undefined
Example for Cotangent of an Angle Find each value by referring to the graphs of the trigonometric functions. cot 11π/4 Since 5π/4 = 2 + π/2, Thencot 5π/4 = 0. You try: cot 3/2
Example for Cosecant of an Angle Find the values of for which each equation is true. csc = -1 From the pattern of the cosecant function, csc=-1 if = 3/2+ 2n, where n is an integer. You try: cscθ = 1
1: Graph Secant = /2+ 2n
Example for Cosecant of an Angle From the pattern of the secant function, sec = 1 if = n, where n is an even integer. Find the values of for which each equation is true. sec = -1 From the pattern of the secant function, sec = -1 if = n, where n is an odd integer. You try: sec θ = 1
2: Graphing Trigonometric Functions Order does matter! y=A ???[B(θ-h)]+k Draw the vertical shift, k, and graph the midline y=k. Use a solid line. Draw the amplitude, . Use dashed lines to indicate the maximum and minimum values of the function. Draw the period of the function, , Graph the appropriate trigonometric curve. Find the phase shift, h, and translate the graph accordingly.
2: Example for Graphing Graph y=csc( -/2)+1. The vertical shift is 1. Use this information to graph the function. Amplitude is 1. The period is 2/1 or 2. The phase shift -(-/2/1)or /2.
2: Example for Graphing YOU TRY! Graph y=csc(2 -/2)+1.
2: Example for Graphing YOU TRY! Graph y=csc(2 -/2)+1. The vertical shift is 1. Use this information to graph the function. The amplitude is 1 The period is 2/2 or . The phase shift -(-/2/2)or /4.
2: Example for Graphing Write an equation for a secant function with period , phase shift –π/2, and vertical shift 3. Substitute these values into the general equation. The equation is y= sec (2 + ) + 3. The vertical shift is k=3. Thus, midline y=3 The amplitude is 1. Thus, draw the dashed lines above and below the midline The period π. Thus, B=2. Draw the Secant curve The phase shift is h=-π/2
2: Example for Graphing YOU TRY. Write an equation for a secant function with period , phase shift π/3, and vertical shift -3. Substitute these values into the general equation. The equation is y = sec (2-2/3)-3. The vertical shift is k=-3. Thus, midline y=-3 The amplitude is 1. Thus, draw the dashed lines above and below the midline The period π. Thus, B=2. Draw the Secant curve The phase shift is h=π/3
Conclusions Summary Assignment Remember the functions tangent and cotangent have a period of . Whereas sine and its reciprocal function cosecant and cosine and its reciprocal function secant both have periods of 2. • 6.7: Graphing Other Trigonometric Functions • Pg400#(13-43 ALL, 45,48 EC) • Problems not finished are left as homework.