Trigonometric graphs
Explore the key concepts of trigonometric functions including graphs of sine, cosine, and tangent. Learn how to label axes and plot special points for each function. Discover the effects of amplitude, frequency, and vertical shifts using general forms of the equations. Engage with exercises that allow you to apply your knowledge, such as comparing graphs of different sine and cosine functions. Embrace the visual aspect by drawing asymptotes for tangent functions and plotting multiple graphs on the same axes.

Trigonometric graphs
E N D
Presentation Transcript
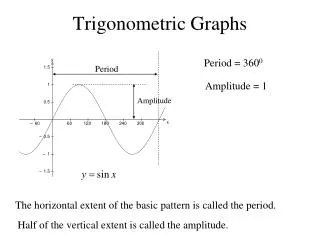
Don’t forget to label the axes! y 1 x 0o 90o 180o 360o 270o -1 Graph of Sine • y = sin x Plot the ‘special’ points!
General Form: y = asin(bx)+c • a affects the amplitude • b affects the frequency (no. of cycles) • c shifts the graph up/down
0o 90o 180o 360o 270o Exercise 1: y = sin(x) + 3 y 4 3 2 1 x -1
0o 90o 180o 360o 270o Exercise 1: y = sin(x) − 2 y 1 x − 1 −2 −3
0o 90o 180o 360o 270o Effect of ‘a’ y 2 • y = sin x and y = 2sin x 1 x −1 −2
y 1 x 0o 90o 180o 360o 270o -1 Effect of ‘b’ • y = sin x and y = sin2x
y 1 x 0o 90o 180o 360o 270o -1 Effect of Modulus • y = sin x and y = |sin x|
Don’t forget to label the axes! y 1 x 0o 90o 180o 360o 270o -1 Graph of Cosine • y = cos x Plot the ‘special’ points!
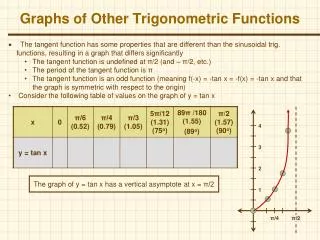
Don’t forget to label the axes! y 1 x 0o 90o 180o 360o 270o -1 Graph of Tangent Draw the asymptotes! • y = tan x Plot the ‘special’ points! Notice that the points at y = 1 are plotted in the middle of the two angles around them!
Know that the amplitude is 2! Know that the graph is translated by 1 unit downwards! Don’t forget to label the axes! y 2 x 0o 90o 180o 360o 270o -2 Draw the reference line y = -1 Example: y = 2cos x – 1 Plot the ‘special’ points! This is the graph of y = 2cos x
y 2 x 0o 90o 180o 360o 270o -2 Example: y = 2cos x – 1 1 -3
Know that the graph is stretched by factor 3 along the y axis! Know that the graph is translated by 6 units downwards! Don’t forget to label the axes! y 3 x 0o 90o 180o 360o 270o -3 Notice that the reference points are now 3 and -3! Example: y = 3tan x – 6 Draw the asymptotes! Plot the ‘special’ points! Notice that the points at y = 1 are plotted in the middle of the two angles around them!
y 3 x 0o 90o 180o 360o 270o -3 -9 Draw the reference line y = -6 Example: y = 3tan x – 6
y 3 0o 90o 180o 360o 270o -3 Example: y = 3tan x – 6 x -9
y 3 0o 90o 180o 360o 270o -3 Example: y = 3tan x – 6 x -9
Don’t forget to label the axes! y 2 x 0o 90o 180o 360o 270o -2 Plotting two graphs on the same axes • y = 2sin x and y = cos x Plot the ‘special’ points!
y 2 x 0o 90o 180o 360o 270o -2 Plotting two graphs on the same axes • y = 2sin x and y = cos x This is the graph of y = 2sinx
y 2 1 x 0o 90o 180o 360o 270o -1 -2 Plotting two graphs on the same axes • y = 2sin x and y = cos x
Label the two graphs! y 2 1 x 0o 90o 180o 360o 270o -1 -2 Plotting two graphs on the same axes • y = 2sin x and y = cos x y = 2sinx y = cosx