Download
1 / 22
240 likes | 420 Vues
Chapter 5 – Trigonometric Functions: Unit Circle Approach. Section 5.3 Trigonometric Graphs. Graph y = sin x. We graph a function by plotting points that satisfy that function in the coordinate system. We will graph the sine function on the period [0,2 ].

E N D
Chapter 5 – Trigonometric Functions: Unit Circle Approach Section 5.3 Trigonometric Graphs 5.3 - Trigonometric Graphs
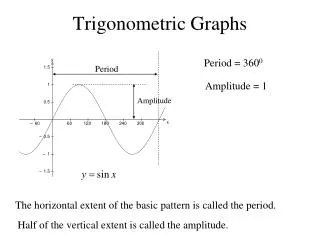
Graph y = sinx We graph a function by plotting points that satisfy that function in the coordinate system. We will graph the sine function on the period [0,2] 5.3 - Trigonometric Graphs
This is called the primary cycle of the sine function. 5.3 - Trigonometric Graphs
Remember that the sine function will repeat indefinitely because it is periodic so we have the graph: 5.3 - Trigonometric Graphs
Properties 5.3 - Trigonometric Graphs
y = A sin (Bx- C) + D We need to know what A, B, C, and D mean on the sine graph. 5.3 - Trigonometric Graphs
Amplitude Amplitude, |A|, adjusts the height of the graph and determines the range of the graph. The range of the function is [-|A|, |A|]. If |A| ≥ 1, then the graph stretches. If |A| ≤ 1, then the graph shrinks. If A < 0, then the graph reflects over the x-axis. 5.3 - Trigonometric Graphs
Period The period is (2)/B 5.3 - Trigonometric Graphs
Phase Shift The phase shift, C/B, will help us find the starting point and ending point of the primary cycle. If C/B < 0, then the graph shifts left. If C/B > 0, then the graph shifts right. 5.3 - Trigonometric Graphs
Vertical Shift Vertical shift, D, shifts the graph vertically. If D > 0, then the graph shifts up D units. If D < 0, then the graph shifts down D units. Max or min y-value is A+D or –A+D. The smaller value is the min and the large value is the max. The graph will be centered vertically on the line y = D. 5.3 - Trigonometric Graphs
Graphing the Sine Function • Identify the A, B, C, and D values • Identify the amplitude, period, and phase shift. • Find the values for the five key points – the three intersection points to y=D, the max, and the min. • Connect the 5 key points with a smooth curve and graph the primary cycle. • Extend the graph if needed. 5.3 - Trigonometric Graphs
Graphing the Negative Sine Function • When graphing the negative sine function, start off by graphing the positive sine function. Then reflect the graph over the y = D line. • NOTE: This will change your minimum and maximums. 5.3 - Trigonometric Graphs
Examples Determine the Sine equation. 5.3 - Trigonometric Graphs
Examples • Determine the amplitude, period, phase shift and vertical shift of the function below. Graph the primary cycle. 5.3 - Trigonometric Graphs
Graph y = cosx We graph a function by plotting points that satisfy that function in the coordinate system. We will graph the cosine function on the period [0,2] 5.3 - Trigonometric Graphs
The primary cycle is in dark blue. 5.3 - Trigonometric Graphs
Properties 5.3 - Trigonometric Graphs
y = Acos(Bx- C) + D Notice that we have the same values as the sine function so we will follow a similar method to graph the cosine function. 5.3 - Trigonometric Graphs
Graphing the Cosine Function • Identify the A, B, C, and D values • Identify the amplitude, period, and phase shift. • Find the values for the five key points –the two maxs, the min, and the two intersection points to y = D, • Connect the 5 key points with a smooth curve and graph the primary cycle. • Extend the graph if needed. 5.3 - Trigonometric Graphs
Graphing the Negative Cosine Function • When graphing the negative cosine function, start off by graphing the positive cosine function. Then reflect the graph over the y = D line. • NOTE: This will change your minimum and maximums. 5.3 - Trigonometric Graphs
Examples Determine the cosine equation. 5.3 - Trigonometric Graphs
Examples • Determine the amplitude, period, phase shift and vertical shift of the function below. Graph the primary cycle. 5.3 - Trigonometric Graphs