A New Twist on Trigonometric Graphs
240 likes | 370 Vues
This article addresses the challenge of graphing the six trigonometric functions for students. It introduces a method that utilizes consistent definitions of basic cycles for each function and constructs a simple frame for one cycle. By plotting a few anchor points, students can sketch and extend the graph effectively. The article also provides step-by-step instructions on how to visualize these functions using interactive GeoGebra applets, emphasizing clarity and consistency to reduce confusion. By exploring both advantages and disadvantages, this approach aims to enhance student understanding of trigonometric graphs.

A New Twist on Trigonometric Graphs
E N D
Presentation Transcript
A New Twist onTrigonometric Graphs Mark Turner Cuesta College
ISSUE How can we simplify the process of graphing the six trigonometric functions for our students?
My Solution • Use consistent definitions of the six basic cycles • Construct a simple frame for one cycle • Plot a few anchor points • Sketch the graph and extend as necessary
First, we will use some interactive java applications to derive the basic cycles for the circular functions.I created these applets using which is free and very user friendly.
GeoGebra Applets Internet Link
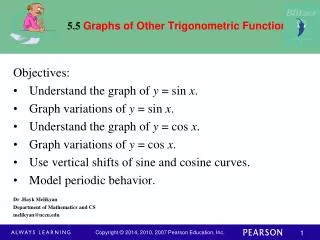
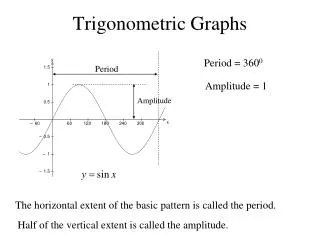
y = sin(x) y = cos(x) THE BASIC CYCLES
y = csc(x) y = sec(x) THE BASIC CYCLES
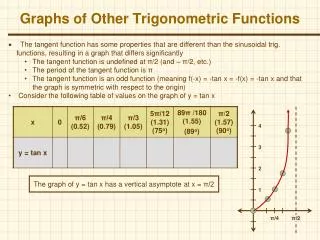
y = tan(x) y = cot(x) THE BASIC CYCLES
1. CONSISTENCY • All six basic cycles begin at zero • By knowing the period, students know the cycle interval
2. LESS CONFUSION • Because the graphs all look different, it is not as easy to confuse one for the other • The phase shift is easier to identify
What are some possible disadvantages of using these definitions?
Visualizing the inverse tangent graph (though this does not appear to be an issue with the sine function) • Most textbooks do not use these definitions
Find the vertical translation and draw a horizontal line (lightly) at this value. Pretend this is now the x-axis. • Find the “amplitude” A. Lightly draw horizontal lines A units above and below the translated x-axis. This gives us the upper and lower sides of the frame.
Solve the compound inequality or for the variable x.
After solving: • the left value is the phase shift, and indicates where a cycle begins • the right value indicates where a cycle ends • the difference of the two values is the period
Find the period and divide it by four. Set the scale on your x-axis so that this value is equal to some whole number multiple of squares (like 2).
Lightly draw vertical lines where the cycle begins and ends. These lines form the left and right sides of the frame.
Subdivide the frame (lengthwise) into four equal sections. To label the three intermediary points, start at the left edge of the frame and add one-fourth the period. Repeat two times.
Plot the anchor points and sketch any asymptotes (don’t forget to check for a reflection and adjust the anchor points accordingly). Within the frame, sketch the graph of a complete cycle through the anchor points.
Extend the graph by duplicating the cycle as necessary • To verify on a graphing calculator, use the frame to help set up an appropriate window.