Download
1 / 34
340 likes | 482 Vues
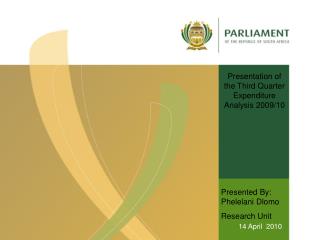
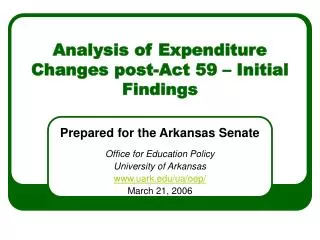
Analysis of Expenditure Changes post-Act 59 – Initial Findings. Prepared for the Arkansas Senate Office for Education Policy University of Arkansas www.uark.edu/ua/oep/ March 21, 2006. Note Regarding Initial Findings.

E N D
Analysis of Expenditure Changes post-Act 59 – Initial Findings Prepared for the Arkansas Senate Office for Education Policy University of Arkansas www.uark.edu/ua/oep/ March 21, 2006
Note Regarding Initial Findings • These findings are only preliminary and are based on the data available at the time of publication. • We do have some concern with the 2003-04 revenue and expenditure categories. • The bulk of the data presented here rely on current expenditures, and it is possible that the growth in current expenditures is overstated by as much as $300 per pupil (our original estimates revealed increases of $1,200 per pupil, which may be revised down to $900 per pupil). • Overall the figures may be changed, however, we believe the trends found in the following tables, where the increases in funding were targeted towards more disadvantaged students, remain correct. • We anticipate having corrected figures and resubmitting them to the Legislature by May 1, 2006.
Motivating Questions • Act 59 increased resources for education in Arkansas • Two overarching questions: • Where did the $ go? • Did performance improve? • First Set of Analyses: • Did overall funding increase? • Are funds targeted toward more disadvantaged districts? • Have teacher salaries increased? • Are there any early signs of performance improvement?
Overview of Changes in Spending: Preliminary Results • Property Tax Revenue up 9% • State General Revenue up 23% • Total Revenue up 26% • Current Expenditures up 13%
II. Composition of Revenue 2003-04 2004-05
Questions • Have funds been targeted to students who have been disadvantaged in the past in Arkansas? • How are resources allocated to the average: • High Poverty Student? • Non-White Student?
Targeted Spending Questions? • Are more disadvantaged districts receiving more resources? • Lowest wealth districts increased by 22% (High Wealth 10%) • Highest poverty districts increased by 23% (Low Poverty 19%) • Funds are targeted so that these districts receive higher levels of school funding: • Districts with more NSLA students • Districts with more non-white students • Districts with more students struggling in ACTAAP • Districts with declining enrollments
Current Expenditures (minus transportation) by Assessed Valuation Per Pupil The red line has “flattened” and resources distributed more evenly by wealth Low Wealth High Wealth
Current Expenditures (minus transportation) by Percent of NSLA Students Districts with more NSLA students have more resources and more new resources Increase 27% NSLA 87% NSLA
Current Expenditures (minus transportation) by Percent of Non-White Students Districts with more minority students continue to have more resources 1.5 - 3.5% non-white 68 - 87% non-white
Current Expenditures (minus transportation) by Percent Proficient or Above on ACTAAP Districts with the most failing students are targeted with additional resources 27% Pro+Adv 67% Pro+Adv
Current Expenditures (minus transportation) by District Growth Rate Districts with declining enrollment have more new resources Increase -22% enrollment +20% enrollment
NSLA Targeted Funds NSLA funding is helping to drive the resources targeted toward more disadvantaged districts Patterns on each of the figures that follow show clear trends in which the neediest districts receive the most resources
NSLA Categorical Funds per Pupil by District Growth Rate -22% enrollment +20% enrollment
NSLA Categorical Funds per Pupil by Assessed Valuation Per Pupil Low Wealth High Wealth
NSLA Categorical Funds per Pupil by Percent of NSLA Students 27% NSLA 87% NSLA
NSLA Categorical Funds per Pupil by Percent of Non-White Students 1.5 - 3.5% non-white 68 - 87% non-white
NSLA Categorical Funds per Pupil by Percent Proficient or Above on ACTAAP 27% Pro+Adv 67% Pro+Adv
NSLA Categorical Funds per Pupil by District Size 375 enrollment 7,800 enrollment
District Size Question ? • How much was spent in the average “small” school district (or rural school district) before and after Act 59? • Current Expenditures 2003-04 = $6,294 • Current Expenditures 2004-05 = $7,516
Current Expenditures (minus transportation) by District Size Biggest increases for small and mid-sized districts Increase 375 enrollment 7,800 enrollment
Teacher Salary Questions ? • Did beginning teacher salaries change? • New teacher salary 2003-04 = $27,218 • New teacher salary 2004-05 = $30,070 • Did average teacher salaries change? • Average teacher salary 2003-04 = $39,409 • Average teacher salary 2004-05 = $41,489 • In what type of districts have beginning teacher salaries changed? • Small Districts (10% in smallest, 5% overall) • Poor Districts (7% in poorest, 5% overall) 10% 5%
Average Teacher Salary by District Size Biggest increases on the left side of the figure in the small districts 375 enrollment 7,800 enrollment
Average Teacher Salary by Assessed Valuation Per Pupil Biggest increases on the left side of the figure in the less wealthy districts $32,000 per pupil $122,000 per pupil
Results of Spending • Since Act 59 – expenditures increased overall (by 13%) and particularly in districts with high minority and high poverty students. • Of course, the ultimate objective of these targeted increases is to improve student performance.
NAEP Advances • Scored at or just below the national average on the 2005 4th and 8th grade math and literacy NAEP exams • One of only two states to make significant improvement on 4th and 8th grade math and literacy NAEP exams (1992-2005 4th grade; 1998-2005 8th grade)
* * NAEP – Grade 4 Mathematics
* NAEP – Grade 4 Reading
* NAEP – Grade 8 Mathematics
Recognition for AP Offerings • 108% increase in Advanced Placement exam participation from 2003-04 to 2004-05. • Highest yearly percent increase in AP exam participation rates in the 50-year history of AP.
Final Thoughts • The resources appear to be in place, now what? • Now, our challenge appears to finding effective and innovative ways to employ the additional resources to improve student performance.
How to Contact: Gary W. Ritter Associate Professor of Education Policy Director, Office for Education Policy Department of Education Reform University of Arkansas Fayetteville, AR 72701 http://www.uark.edu/ua/oep/ garyr@uark.edu