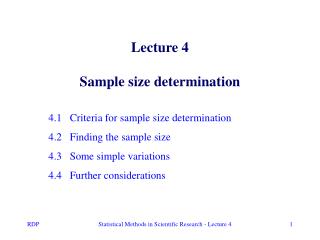
Sampling Procedures and sample size determination.
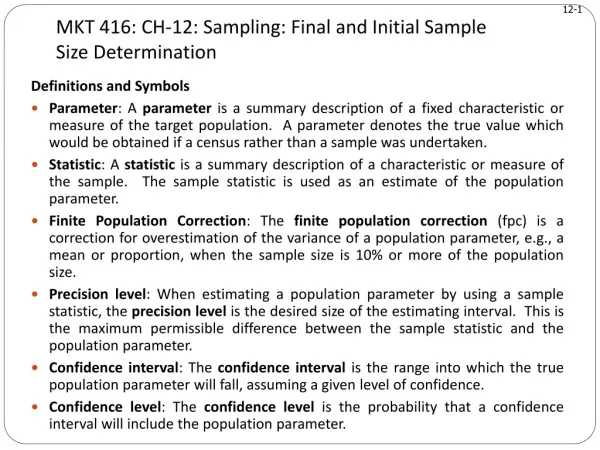
Sampling Procedures and sample size determination. Prepared by dr. Surej for Mr students of Assumption University. Basic concepts. Population: the entire group under study (or of interest)


Sampling Procedures and sample size determination.
E N D
Presentation Transcript
Sampling Procedures and sample size determination. Prepared by dr. Surej for Mr students of Assumption University.
Basic concepts • Population: the entire group under study (or of interest) • Population is the collection of elements or objects that possess the information sought by the researcher and about which inferences are to be made. • Sample: subset of the population • Used to represent the population • Sample unit (elements): basic unit investigated (choose sampling units/elements when sampling) • Individuals, households, etc. • Census: data collected from EVERYONE in population
Non Probability sampling techniques: • In Non-probability sampling techniques, probability of selection not known, and hence representativeness cannot be assessed.
Convenience Sampling attempts to obtain a sample of convenient elements. Often, respondents are selected because they happen to be in the right place at the right time. • use of students, and members of social organizations • mall intercept interviews without qualifying the respondents • department stores using charge account lists • “people on the street” interviews
A Graphical Illustration of Convenience Sampling Group D happens to assemble at a convenient time and place. So all the elements in this Group are selected. The resulting sample consists of elements 16, 17, 18, 19 and 20. Note, no elements are selected from group A, B, C and E.
Judgmental Sampling Judgmental sampling is a form of convenience sampling in which the population elements are selected based on the judgment of the researcher. • test markets • purchase engineers selected in industrial marketing research • bellwether precincts selected in voting behavior research • expert witnesses used in court
Graphical Illustration of Judgmental Sampling The researcher considers groups B, C and Eto be typical and convenient. Within each of these groups one or two elements are selectedbased on typicality and convenience. The resulting sample consists of elements 8, 10, 11,13, and 24. Note, no elements are selected from groups A and D.
Quota Sampling may be viewed as two-stage restricted judgmental sampling. • The first stage consists of developing control categories, or quotas, of population elements. • In the second stage, sample elements are selected based on convenience or judgment. Population SamplecompositioncompositionControlCharacteristic Percentage Percentage NumberSex Male 48 48 480 Female 52 52 520 ____ ____ ____ 100 100 1000
A Graphical Illustration of Quota Sampling A quota of one element from each group, A to E, is imposed. Within each group, oneelement is selected based on judgment or convenience. The resulting sample consistsof elements 3, 6, 13, 20 and 22. Note, one element is selected from each column or group.
Snowball Sampling In snowball sampling, an initial group of respondents is selected, usually at random. • After being interviewed, these respondents are asked to identify others who belong to the target population of interest. • Subsequent respondents are selected based on the referrals.
A Graphical Illustration of Snowball Sampling Elements 2 and 9 are selected randomly from groups A and B. Element 2 refers elements 12 and 13. Element 9 refers element 18. The resulting sample consistsof elements 2, 9, 12, 13, and 18. Note, there are no element from group E.
Simple Random Sampling • Each element in the population has a known and equal probability of selection. • Each possible sample of a given size (n) has a known and equal probability of being the sample actually selected. • This implies that every element is selected independently of every other element.
A Graphical Illustration of Simple Random Sampling Select five random numbers from 1 to 25. The resulting sample consists of population elements 3, 7, 9, 16, and 24. Note, there is no element from Group C.
Systematic Sampling • The sample is chosen by selecting a random starting point and then picking every ith element in succession from the sampling frame. • The sampling interval, i, is determined by dividing the population size N by the sample size n and rounding to the nearest integer. • When the ordering of the elements is related to the characteristic of interest, systematic sampling increases the representativeness of the sample.
Systematic Sampling • If the ordering of the elements produces a cyclical pattern, systematic sampling may decrease the representativeness of the sample. For example, there are 100,000 elements in the population and a sample of 1,000 is desired. In this case the sampling interval, i, is 100. A random number between 1 and 100 is selected. If, for example, this number is 23, the sample consists of elements 23, 123, 223, 323, 423, 523, and so on.
A Graphical Illustration of Systematic Sampling Select a random number between 1 to 5, say 2. The resulting sample consists of population 2, (2+5=) 7, (2+5x2=) 12, (2+5x3=)17, and (2+5x4=) 22.Note, all the elements are selected from a single row.
Stratified Sampling • A two-step process in which the population is partitioned into subpopulations, or strata. • The strata should be mutually exclusive and collectively exhaustive in that every population element should be assigned to one and only one stratum and no population elements should be omitted. • Next, elements are selected from each stratum by a random procedure, usually SRS. • A major objective of stratified sampling is to increase precision without increasing cost.
Stratified Sampling • The elements within a stratum should be as homogeneous as possible, but the elements in different strata should be as heterogeneous as possible. • The stratification variables should also be closely related to the characteristic of interest. • Finally, the variables should decrease the cost of the stratification process by being easy to measure and apply.
Stratified Sampling • In proportionate stratified sampling, the size of the sample drawn from each stratum is proportionate to the relative size of that stratum in the total population. • In disproportionate stratified sampling, the size of the sample from each stratum is proportionate to the relative size of that stratum and to the standard deviation of the distribution of the characteristic of interest among all the elements in that stratum.
A Graphical Illustration of Stratified Sampling Randomly select a number from 1 to 5 for each stratum, A to E. The resulting sample consists of population elements 4, 7, 13, 19 and 21. Note, one element is selected from each column.
Cluster Sampling • The target population is first divided into mutually exclusive and collectively exhaustive subpopulations, or clusters. • Then a random sample of clusters is selected, based on a probability sampling technique such as SRS. • For each selected cluster, either all the elements are included in the sample (one-stage) or a sample of elements is drawn probabilistically (two-stage).
Cluster Sampling • Elements within a cluster should be as heterogeneous as possible, but clusters themselves should be as homogeneous as possible. Ideally, each cluster should be a small-scale representation of the population. • In probability proportionate to sizesampling, the clusters are sampled with probability proportional to size. In the second stage, the probability of selecting a sampling unit in a selected cluster varies inversely with the size of the cluster.
A Graphical Illustration of Cluster Sampling (2-Stage) Randomly select 3 clusters, B, D and E. Within each cluster, randomly select one or two elements. The resulting sample consists of population elements 7, 18, 20,21, and 23. Note, no elements are selected from clusters A and C.
Technique Strengths Weaknesses Nonprobability Sampling Least expensive, least Selection bias, sample not Convenience sampling time-consuming, most representative, not recommended for convenient descriptive or causal research Judgmental sampling Low cost, convenient, Does not allow generalization, not time-consuming subjective Quota sampling Sample can be controlled Selection bias, no assurance of for certain characteristics representativeness Snowball sampling Can estimate rare Time-consuming characteristics Probability sampling Easily understood, Difficult to construct sampling Simple random sampling results projectable frame, expensive, lower precision, (SRS) no assurance of representativeness. Systematic sampling Can increase Can decrease representativeness representativeness, easier to implement than SRS, sampling frame not necessary Stratified sampling Include all important Difficult to select relevant subpopulations, stratification variables, not feasible to precision stratify on many variables, expensive Cluster sampling Easy to implement, cost Imprecise, difficult to compute and effective interpret results Strengths and Weaknesses of Basic Sampling Techniques