Survey Methodology Sampling error and sample size
Survey Methodology Sampling error and sample size. EPID 626 Lecture 4. Lecture overview. Finish discussion of nonprobability sampling Discuss sampling error Discuss sample sizes Some practical exercises. Nonprobability sampling designs.

Survey Methodology Sampling error and sample size
E N D
Presentation Transcript
Survey MethodologySampling error and sample size EPID 626 Lecture 4
Lecture overview • Finish discussion of nonprobability sampling • Discuss sampling error • Discuss sample sizes • Some practical exercises
Nonprobability sampling designs • Focus groups: small group chosen because the investigator believes they accurately reflect the population of interest- usually used for planning or piloting
Advantages Cost Efficiency Effort May be the only option Disadvantages Bias Bias Bias Not a valid representation of the population Advantages and Disadvantages
When would nonprobability sampling be appropriate? • Surveys of hard-to-identify groups (ex. A survey of goals and aspirations among gang members) • Surveys of specific groups (ex. A survey about pain among hospice patients) • Surveys in pilot situations (used for planning purposes, not for research per se)(Fink, 1995)
Sampling error • The central limit theorem: In a sequence of samples of a population, for a particular estimate (say a mean), there will be a normal distribution around the true population value.
This variation around the true value is the sampling error-it stems from the fact that, by chance, samples may differ from the population as a whole.
The larger the sample size and the less variance of what is being measured, the more tightly the sample estimates will “bunch” around the true population value, and the more accurate the sample-based estimate will be.
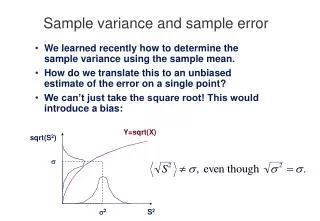
Standard error of a mean • The standard deviation of the distribution of sample estimates of the mean that would be formed if an infinite number of samples of a given size were drawn.
~67% of the means of samples of a given size and design will fall within the range of 1 SE of the true population mean • ~95% will fall within 2 SE -this is where we derive a 95% confidence interval
Proportions • Mean of a two-value (binomial) distribution • Var of a proportion = p(1-p) • So the
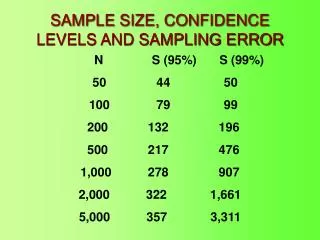
Table 2.1Confidence Ranges for Variability Attributable to Sampling • Trends • If sample size=75 and p=20,
Confidence intervals • In a survey of 100 respondents, 20% say yes. What is the confidence interval for a 95% confidence level? • In a survey 250 respondents, 10% say yes. What is the confidence interval for a 95% confidence level? What if 50% said yes?
In a survey of 100 respondents, 20% say yes. What is the confidence interval for a 95% confidence level? • Interval is 8. • 95% CI=(12%, 28%)
In a survey 250 respondents, 10% say yes. What is the confidence interval for a 95% confidence level? What if 50% said yes? • Interval is about 3.8. • 95% CI is about (6.2%, 13.8%) • If 50% said yes, CI is about (3.7%, 16.3%)
Sampling error and sampling strategy • SRS is approximated by the standard error • Systematic sampling • If not stratified, sampling error is the same as in SRS. • If stratified, errors are lower than those associated with SRS for the same size for variables that differ (on average) by stratum, if rates of selection are constant across strata.
Sampling error and sampling strategy (2) • Unequal rates of selection decrease sampling error for oversampled groups. • It will generally produce sampling errors for the whole sample that are higher than those associated with SRS of the same size for variables that differ by stratum.
Sampling error and sampling strategy (3) • But when oversampling occurs in strata that have higher than average variances, overall sampling errors will be lower than for a sample of the same size with equal probabilities of selection. (see Fowler text p.32 for more extensive discussion)
Sampling error and sampling strategy (4) • Clusters will produce sampling errors that are higher than SRS for the same size for variables that are more homogenous within clusters than in the population as a whole.