Download

1 / 69
1k likes | 2.52k Vues
Sample size calculation and development of sampling plan. Real population value. Overview. Bias versus sampling error Level of precision Calculating sampling size Single survey using random sampling Single survey using two-stage cluster sampling Comparing two surveys

E N D
Sample size calculation and development of sampling plan Real population value
Overview • Bias versus sampling error • Level of precision • Calculating sampling size • Single survey using random sampling • Single survey using two-stage cluster sampling • Comparing two surveys • Drawing the sample • First stage • Second stage • Developing a sampling plan
Introduction Result from survey is never exactly the same as the actual value in the population WHY?
Bias and sampling error Point estimate from sample 45% True population value 50% Total difference = 5 percentage points Sampling error Bias
Bias Results from: • Enumerator/respondent bias • Incorrect measurements (anthropometric surveys) • Selection of non-representative sample • Likelihood of selection not equal for each sampling unit
Sampling error Sampling error • Difference between survey result and population value due to random selection of sample • Influenced by: • Sample size • Sampling method Unlike bias, it can be predicted, calculated, and accounted for
Example 1: Small or large sample? Bias or no bias? Small sample size without bias: Real population value
Example 2: Small or large sample? Bias or no bias? Large sample size without bias Real population value
Example 3: Small or large sample? Bias or no bias? Large sample size with bias: Real population value
Precision versus bias • Larger sample size increases precision • It does NOT guarantee absence of bias • Bias may result in very incorrect estimate • Quality control is more difficult the larger the sample size • Therefore, you may be better off with smaller sample size, less precision, but much less bias.
Calculating sample size - Introduction • Sample size calculations can tell you how many sampling units you need to include in the survey to get some required level of precision
FS & nutrition surveys: sampling considerations If a nutritional survey is conducted as part of CFSVA, additional considerations on sampling are requiredtoreconcile the 2 surveys. Why? • Food security analysis has less strict demands on the precision of a single indicator (convergence of evidence) → few % points difference in prevalence of FS is acceptable. • A difference of a few % points in wasting prevalence can have considerable implications for programmes.
FS & nutrition surveys: sampling considerations (cont.) The final HH sample size depends on the objective of collecting nutritional info. goal is to study the link between food security & nutrition → smaller sample sizes are sufficient goal is to provide accurate & precise prevalenceon nutrition indicators → nutrition sample size has to be adequate (larger)
Nutrition survey sample size: 30*30 (?) Why the 30*30 method was proposed and why is not necessary to compute the nutrition survey sample size? Proposed to ensure enough precision. It assumes that: • Prevalence of the core indicator is 50% • Desired precision is -/+ 5 percentage points • DEEF = 2 • 15% of the HHs or kids will refuse
Calculate sample size – single survey using random sample To estimate sample size, you need to know: • Estimate of the prevalence of the key indicator (e.g. rate of stunting) • Precision desired (for example: ± 5%) • Level of confidence (always use 95%) • Expected response rate • Population • For nutrition surveys: number of eligible individuals per household
NOTE: As long as the target population is more than a few thousand people, you do not need to consider it in the sample size. You do NOT generally need a larger sample size if the population is bigger.
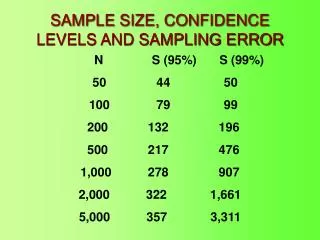
Sample size formula (single survey using random sampling) To calculate sample size for estimate of prevalence with 95% confidence limit • N = 1.962 x (P)(1-P) • d2 • 1.96 = Z value for 95% confidence limits • P = Estimated prevalence (e.g. 0.3 for 30%) • d = Desired precision (e.g. 0.05 for ± 5%)
Steps for calculating the sample size 1. Decide on key indicator 2. Estimate prevalence of key indicator 3. Decide on precision required 4. Calculate initial sample size using formula 5. Adjust for individual non-response 6. Adjust for eligible members 7. Adjust for household non-response Final sample size
Step 2: Where do get information to make assumption about prevalence? • Prior surveys • Qualitative estimates • “Worst case” scenario: use prevalence of 50%
Step 3: How do we decide on the needed precision? • One-time results for advocacy alone does not need much precision (0.10 good enough) • Results that you will need to compare against in the future need greater precision (0.05 if program will have large impact) • Results you will monitor frequently (e.g. year by year) need even greater precision (0.02)
Step 4: Calculate required sample size Survey anemia in children under-5 • Assume prevalence of anemia = 40% (0.40) • Need precision of +/- 5% (0.05) N = 1.962 x (P)(1-P) • d2 • 1.96 = Z value for 95% confidence limits • P = Estimated prevalence • d = Desired precision
Step 4 (cont.): Calculate required sample size N = 1.962 x (P)(1-P) • d2 • 1.96 = Z value for 95% confidence limits • P = Estimated prevalence • d = Desired precision (for example, 0.05 for ± 5%) P = 0.4 1.962 x 0.4 x 0.6 = 369 (1-P) = 0.6 0.052 children d = 0.05
Step 5: Adjust sample size for individual non-response • Some children will refuse or be unavailable • Therefore, inflate sample size to account for individual non-response Example: If 10% non-response (90% response): Sample size x 0.9 = new sample size 369 / 0.90 = 410 children
Step 6: Adjust sample size for number of eligible individuals • If the unit of analysis is the individual within the household there is a need to readjust the number of selected households Example: If 0.7 children per household: Sample size (children) / 0.7 = Number of HHs needed 410 = 586 HHs 0.7
Step 7: Adjust sample size for household non-response Some households will refuse or be unavailable Therefore, inflate sample size to account for household non-response Example: If 15% non-response (85% response): Sample size x 0.85 = new sample size 586 / 0.85 = 689 HHs Final sample size
Sample size for more than 1 key indicator Decide what are the key indicators Calculate sample sizes for each individual key indicator Choose largest sample size required Example:
Introduction • Cluster sampling results in loss of precision compared to simple random sampling. • When calculating sample size, must increase sample size to obtain the same precision. • When calculating confidence intervals during data analysis, must take into account cluster sampling.
Calculate sample size – single survey using two-stage cluster sampling To estimate sample size, you need to know: • Estimate of the prevalence of the key indicator (e.g. rate of stunting) • Precision desired (for example: ± 5%) • Level of confidence (always use 95%) • Expected response rate • Population • For nutrition surveys: number of eligible individuals per household IN ADDITION TO THE ABOVE, THE DESIGN EFFECT
6. Calculate sample sizeCluster surveys N = DEFF x 1.962 x (P)(1-P) d2 DEFF = Design effect 1.96 = Z value for p = 0.05 or 95% confidence intervals P = Estimated prevalence d = Desired precision (for example, 0.05 for ± 5%) To calculate sample size for estimate of prevalence with 95% confidence interval taking into account cluster sampling
Design effect • Design effect increases when • Key indicators are highly geographically clustered (e.g. water source, access to health care) • When number of clusters are decreased and size of clusters are increased • To minimize design effect • Include more clusters of smaller size • Stratify sample into more homogeneous groups
Example: Prevalence of malaria in 6 villages = child with malaria = child without malaria
Prevalence = 50% Prevalence = 50% Prevalence = 50% Example 1: Malaria evenly spread throughout population Village E Village A Village C Village F Village D Village B
Prevalence = 50% Prevalence = 100% Prevalence = 0% Example 2: Malaria unevenly spread throughout population (2 clusters) Village A Village C Village E Village D Village B Village F
Prevalence = 17% Prevalence = 83% Example 3: Malaria unevenly spread throughout population (3 clusters)
Where do you get design effect to calculate sample size? • Ideally prior surveys • We often use ‘2’ as an estimate for a two-stage cluster sampling (comes from immunization coverage in rural Africa)
Example: Design effect for selected key indicators in Mongolia Why is this so high?
Example: Design effect for selected key indicators in Mongolia If sample size for simple random sampling = 120 • What is sample size for a 2-stage cluster survey if iodated salt is key indicator (DEFF 4.5)? DEFF = 4.5, therefore 120 x 4.5 = 540
How do we decide on how many clusters? • More clusters of smaller size results in smaller design effect • But more clusters increases cost and time required • Fewer than 30 clusters results in high design effect • But >30 clusters doesn’t decrease design effect much
Comparing two surveys - Introduction • When comparing 2 surveys • Want to be sure any difference is not due only to sampling error • Uses different formula • To calculate sample size, make following assumptions: • Estimated prevalence in survey 1 • Decide difference between 2 surveys you want to be able to detect
Comparing two surveys - Formula Calculate sample size to compare prevalence estimates from 2 surveys; both surveys with equal sample sizes
Comparing two surveys – Formula (cont.) But no need to memorize these equations: • Found in most statistics books (e.g. FANTA sampling guidelines) • Use computer to calculate sample sizes, including EpiInfo, nutri-survey, etc.
First stage – Cluster requirements • Size • Smaller clusters make second stage sampling easier • But not too small – each cluster should have the required minimum number of households • Known boundaries • Must be able to tell if individual households belong to a cluster or not • Possible clusters: villages, blocks, enumeration areas
50 HHs 10 HHs What does proportioal to population size (PPS) mean? • Larger clusters are more likely to be chosen than smaller clusters • If choose PSUs probability proportional to size (PPS), probability of any single household or person in population being chosen is the same