Download

1 / 15
160 likes | 390 Vues
Magnetic Reconnection Rate and Energy Release Rate. Jeongwoo Lee 2008 April 1 NJIT/CSTR Seminar Day. Magnetic Reconnection Theory. Sweet-Parker theory All the reconnection plasma flows through the shaded diffusion region. Very slow reconnection results. Petschek theory

E N D
Magnetic Reconnection Rate and Energy Release Rate Jeongwoo Lee 2008 April 1 NJIT/CSTR Seminar Day
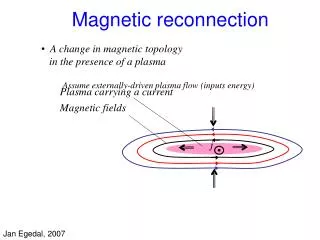
Magnetic Reconnection Theory Sweet-Parker theory All the reconnection plasma flows through the shaded diffusion region. Very slow reconnection results. Petschek theory The reconnection region has been shrunk to a dot in the center. The plasma is accelerated at slow-mode shock waves. Note: can tell which theory is right!
Magnetic Reconnection Experiment (PPPL) The vacuum vessel and equilibrium field coils (blue) of the MRX. A plasma discharge in MRX. The two flux cores and magnetic diagnostics are visible. • An example of driven magnetic reconnection measured in a single shot by a 2D probe array: • vector plot of poloidal field • poloidal flux contours. • Toroidal field (the 3rd component) is negligibly small. The MRX experiment by H. Ji, et al. (1998, Phys. Rev. Lett. 80, 3256) showed the Sweet-Parker type of Magnetic Reconnection.
Where is the Petschek type reconnection?A determination of magnetic reconnection rate in astronomical bodies is desirable. For instance, A soft X-ray image of the sun. Reconnection is thought to play a role in coronal heating and solar flares. The charged particles which create the aurora are thought to be accelerated through magnetic reconnection.
Optical Ha observations typically show elongated ribbon structures drifting apart from each other, which behavior inspired a "standard model" for the solar flare. In this model, the rapid eruption of a filament enables the magnetic field to reconnect, driving particle acceleration in the underlying loops. As successive field lines are reconnected at higher altitudes, whose foot-points are located further apart from each other. (Cartoon by P. Gallagher)
1. Idea and Goal Dimensionless magnetic reconnection rate tells about the physics of reconnection. Local magnetic reconnection rate can be measured in two-ribbon solar flares. Fig.1–Magnetic field, velocity, and length scales involved with 2D magnetic reconnection.
2. Method Fig.2– Proposed reconnection geometry. Reconnection rate By requiring the magnetic energy release rate and the electron energy deposition rate to agree with each other, we will determine the dimensionless magnetic reconnection rate.
3. Ribbon Candidates Fig. 3. —Flare ribbons at Ha line center and blue wing. Left: Ha center-line image Middle: Ha-1.3 A plotted over the Ha line-center image (contours). Right: 1-D profiles of the Ha-1.3 A (thin line) and line-center emission (thick line). The blue-wing ribbon emission appears much narrower and is confined to the leading edge of the line-center ribbon and may better represent the instantaneously reconnecting area in the chromosphere.
4. Results Fig. 4.—Hard X-ray map and light curves in comparison with Ha (Sep 09, 2002). Left: RHESSI map at 25–50 keV (contours) on top of a BBSO Ha blue-wing image. The HXR emission appears as a static source between the Ha kernels, maybe a loop source. Right: HXR light curve at 25–50 keV, time derivative of the Ha -1.3 A light curves at ribbon a1 (black line) and a2 (gray line), and at ribbon b, respectively.
Fig. 5.—Location and area of the Ha blue-wing ribbon on an MDI magnetogram. Left: Emission contours show the areas of the ribbon at selected four times t1—t4. Right: Filled symbols show the locations of the center of mass of the ribbon. The color scale for time is shown. t1—t4 refer to 17:43:26, 45:22, 46:45, and 49:22 UT, respectively.
Fig. 6.—Distance of the center of mass of the ribbon (symbols) as a function of time. Four time intervals during which the distance rapidly increases are marked with solid guide lines along with the inferred speeds. Another fit to the over all motion in the entire period is also shown as a thick gray line for comparison.
Fig. 7.—Physical parameters of the magnetic reconnection as functions of time in the 2002 September 9 flare. The top three panels show observed parameters: local magnetic field strength, ribbon velocity, and area. The bottom three panels show derived quantities: electric field, flux change rate, and energy release rate. The gray histogram in each panel shows the RHESSI count rate at 25–50 keV for reference.
Table 1Electron Energy Deposition Rate versus Magnetic Energy Release Rate (M=1) gives M = 0.85 0.37 0.47 0.11
5. Conclusion • The magnetic energy release rate devided by M can be estimatedusing the time dependent diffusion region area (requires radiations that can represent the instantaneously reconnecting region). • The episodic variations of the ribbon area and motion provides a clue to an important question: which physical quantity drives the magnetic reconnection. • So, if HXR spectra give a reliable estimate of the electron energy, we may determine the dimensionless magnetic reconnection rate, a key parameter in the magnetic reconnection physics.