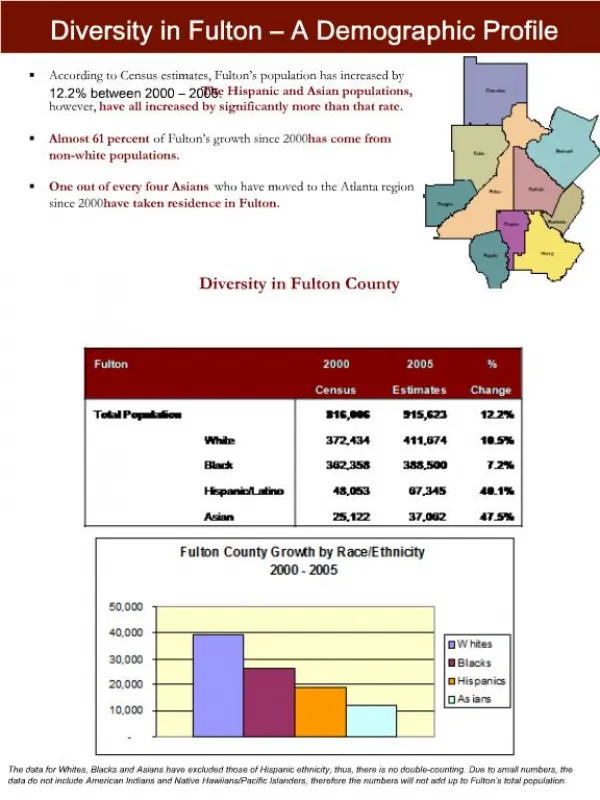
Privacy in a Demographic Database
This milestone involves manual generation of tables from the Israel Central Bureau of Statistic's website to understand survey data intersections. The next step includes pulling data using scripts for privacy analysis. The process includes filtering data for specific participant profiles. Tables are analyzed to extract information about participants based on demographics, such as age, gender, location, occupation, and more. Future plans involve automating the extraction of survey tables and developing an algorithm to search for specific data points in the database. The project faces challenges with website compatibility and exploring alternatives like Scrapy, curl in bash, or JTidy in Java.

Privacy in a Demographic Database
E N D
Presentation Transcript
Privacy in a Demographic Database Milestone #1 Razi Mukatren, Golan Salman
Milestone #1 • We started the privacy analysis of the Data. • we manually generate tables from the Israel Central Bureau of Statistic's website - more than 40 tables. • Understanding the specific technique that the CBS uses for their website. • From the pulled Data, we learned the tables, we manually looked for intersection between the data in order to understand more about the surveys • Next Step: pulling the data/tables from the website using a script.
the privacy analysis of the system We run manually tests, we saw it’s possible to create information about specific participant in the survey. For example: Taking all 7,500 participants data and filtering only those who: 1) Studied some subject that connects to education. 2) Has incoming profit of more than 24,000 NIS per month.
For example : • We generated 10 Tables and use the following filters: • Arab villages and • Religion – Muslims. • Filter used to reduce the size of the table, what we mean that we will get the info only related to the above Filters.
The survey has only 12 people who live in Arab villages and Muslims (we can learn this from Table #1. Six of them are men, and six are women. Also, we can see the ages of those 12 people in the tables below. • Now we’ll look in the tables which includes in total 12 participates, since they for sure will include all the 12 participates from the Table #1.
From table #5 we can learn that for example the participates between age 20-24 one his height 120 -124 the second 185-189. • From table #5 we can learn that for example the participates between age 20-24 one his height 120 -124 the second 185-189. • Now if we go back to table #1 we will see that one is man one is women, to see who is who we will generate new table includes same filters and we will add second column for gender • Will name it table 11, from table 11 we can see the Women her height is 160-164, and the men 185-189. • Let’s focus only on this 2 participates for example because one of them appears in all the 10 tables (we have age 20-24 in all the 10 tables).
From table #2, we can see that one of them hired worker, let’s generate new table (called table12) and check who is the hired worker the man or the women. We can see from table number 12 that the man is the hired worker. • So far we know about the Man, his age 20-24, Muslim, from Arab village, his height 185-189, and hired worker.
From table #3 and table #4, we can learn that he work in the constructions and he far about 15-30 min driving from his work. • From table #6, both of them the man and the women study 11-12 years
From table #7 one of them weight 90- 94 and the other 65- 69, let’s generate new table (13) and check which one is the man, from table 13 we can see that the man weight between 90-94 Kg.
From table #8 he makes from 5K – 6K NIS gross. • Table #9 he is from the north. • Table #10 we need to generate new table #14, from table 14 we can see that his family includes more than 7 members.
In conclusion: • We know about the Man, • His age 20-24 • Muslim • From Arab village, • His height 185-189 • Hired worker • Distance from work 15-30 min driving • Studying Years11-12 • he weighs 90-94 Kg • His salary 5K-6KNIS gross per month • he is from the north • His family includes more than 7 members.
Where are we going From hereNext steps • Two major points (the plane is to finish them until milestone 2): • automatic extracting and generating survey’s tables from the CBS (it will be the first script). • Start working in the algorithm for searching in the data for the “1”, and try to find intersections between this information (it will be the second script).
The first script and major issues • The website support only IE. • We though that we can use a macro script using FF or Chrome, but since the IL Governments sites support only IE so we can’t use the macros scripts. • Now we are testing alternatives: • Either Scrapy: http://scrapy.org/ • used to crawl websites and extract structured data from their pages. It can be used for a wide range of purposes, from data mining to monitoring and automated testing. • or curl in bash • or java with http://jtidy.sourceforge.net/ - JTidy is a Java port of HTML Tidy