Download
1 / 20
260 likes | 617 Vues
Effects of Crystal Elasticity on Rolling Contact Fatigue. Neil Paulson Ph.D. Research Assistant. Outline. Motivation and Background Crystal Structure Definitions Polycrystalline Material Model Steel Material Stiffness Model Hertzian Contact Modeling RCF Relative Life Study Future Work.

E N D
Effects of Crystal Elasticityon Rolling Contact Fatigue Neil Paulson Ph.D. Research Assistant
Outline • Motivation and Background • Crystal Structure Definitions • Polycrystalline Material Model • Steel Material Stiffness Model • Hertzian Contact Modeling • RCF Relative Life Study • Future Work
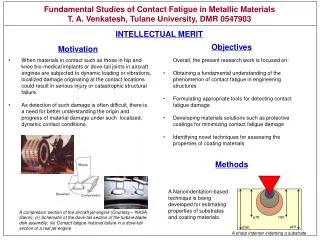
Background and Motivation • Material heterogeneity can play a role in rolling contact fatigue failure, • Microstructure Topology • Raje, Jalalahmadi, Slack, Weinzapfel, Warhadpande, Bomidi • Voids or inclusions • Microstructure anisotropy • Microstructures are composed of many grains of multiple crystal phases • The relation between stress and strain depend on how atoms are arranged in the crystal phase Grain Micrograph from electron backscatter diffraction (EBSD) scan showing grain orientations1 Objective Extend current RCF FE model to incorporate the effects of crystal elasticity on RCF 1“Bruker Quantax EBSD Analysis Functions” Bruker Corp., 2013
Homogenous & Isotropic Material Models • Model for the bulk material behavior • Material stiffness does not depend on the direction • Infinite planes of symmetry • Only two independent elastic constants are needed to define the stress strain response Stress-Strain Equations
Cubic Crystal Structure • Most widely used to incorporate crystal elasticity • Elastic constants for many materials are available in literature • Orientation of the crystal becomes important • The shear modulus is decoupled from E and ν; otherwise the equations remain identical to isotropic material model • 3 elastic constants are needed to define the stress strain response Stress-Strain Equations Shear modulus is independent of E and ν
Modeling Polycrystalline Aggregates Cubic Stiffness Matrix Isotopic Stiffness Matrix Each individual crystal has a unique orientation Euler Angles rotate the local stiffness matrix into the global coordinate frame Isotropic stiffness matrix is identical after rotation Cubic stiffness matrix becomes fully anisotropic after rotation
Material & Model Verification • A representative model of polycrystalline material was developed using Voronoi cells to represent individual grains • The stiffness matrix of each grain was rotated to the global coordinates • Uniaxial Strain was applied • Reaction forces were measured • Global material properties of the model were evaluated1: 1 Toonder, J, Dommelen, J, Baaijens, F. The relation between single crystal elasticity and the effective elastic behaviour of polycrystalline materials: theory, measurement and computation, ModellingSimul. Mater. Sci. Eng.
Steel Material Model • FEA results match isotropic constants Example Cases
Rolling Contact Fatigue Domain Strong stress gradients inside grains require modifications to FE domain Isotropic Domain Anisotropic Domain Voronoi Centroid Discretization Fixed Element Area Discretization Anisotropic Isotropic Linear Strain Elements Constant Strain Elements
Anisotropic Hertzian Contact • Isotropic Material • Hertzian Centerline Stresses • Anisotropic Material • Anisotropic stress profiles deviate from isotropic stresses • Stress concentrations occur at grain boundaries due to orientation change
Rolling Contact Fatigue Life Equations Microstructures models simulate randomness from experimental testing Lundberg-Palmgren equation can be reduced for constant survivability and volume: Three different numerical models have been proposed with Isotropic Voronoi Element microstructure 2D Discrete Element Model 2D Finite Element Model 3D Finite Element Model 3.36 2.65 4.55 the experiments of Lundberg and Palmgren
Modeling Rolling Contact • Hertzian Line Contact Load • 21 Loading Steps • Load Transverses Anisotropic Region • was evaluated for each element • Maximum value and location recorded
Shear Stress Reversal Results 33 crystal orientation maps were run for a given topological model • Anisotropic shear stress increased by orientation mismatch • Isotropic shear stress matches theory • Isotropic Shear Stress independent of grain boundaries • Experimentally Observed μ-crack Bounds1 • Maximum Shear Stress on Voronoi Boundaries 1 Chen, Q., Shao, E., Zhao, D., Guo, J., & Fan, Z. (1991). Measurement of the critical size of inclusions initiating contact fatigue cracks and its application in bearing steel. Wear, 147, 285–294.
RCF Relative Life • Relative life equation was used to determine bearing fatigue life • Shear Stress results from crystal orientations were used to create Weibull plot of RCF life • 33 Different topological microstructures
RCF Relative Life All topological domain results combined into one RCF relative life plot Weibull Distribution Function 2-Parameter Weibull 3-Parameter Weibull
Current Model Development • Implement damage mechanics coupled with crystal elasticity to model both crack initiation and propagation • Develop a multi-phase representative model for bearing steel microstructure • Model a nonuniform distribution of crystal orientations (texture) -phase -phase
Measurement of Skidding in Cam and Roller Follower • Skidding in Cam and Followers causes wear and premature failure • A test rig has been developed to study the causes of skidding • An analytical model is under development to model the causes of skidding
Cam and Follower Test Rig Shaft Coupling – rigidly connects the driven shaft and camshaft Test Cell – Assembly contains the camshaft, tappet, lubrication pathways and speeds sensor Speed Measurement Flywheel – 700 mm flywheel to maintain constant shaft speed under alternating load conditions - Tappets are machined to hold optical sensor - Rollers are laser etched with 20-60 divisions - Time between divisions is measured with optical sensor - Sensor is sealed from environment with sleeve One way Clutch Allows deceleration under flywheel inertia for Stribeck curve data Drive Motor – 55 HP provides power to camshaft with speeds up to 1800 RPM
Test Rig Roller Skidding • Skidding created with modified roller follower • Skidding only apparent at low loads • Results show a transition from skidding into a pure rolling regime • Short skidding regions are seen after the transition to rolling regime Cam shows initial stages of skidding wear Skidding Region Intermittent Skid Rolling Region
Analytical Roller Skidding Model 2D roller skidding model under development • EHL of cam and roller interface ( • HL of roller and pin joint • Kinematics of cam and follower • Torque Balance to find angular velocity ( I ∙ αroller W∙ μaxle W∙ μcam W ωcam EHL & Mixed EHL Torque Balance Cam Kinematics HL