Analysis of Participation in Further and Higher Education Among Scottish Domiciled Students
This report summarizes participation trends in further education (FE) and higher education (HE) among Scottish domiciled individuals aged 16 and older. It explores variations in participation across geographies and demographics, utilizing data from SFC, HESA, and school pupil censuses. The findings highlight a decline in total enrollment from 2003-04 to 2007-08, significant geographical disparities in participation rates, and disparities between genders. Key metrics and methodologies for measuring participation, including Standardised Participation Ratios, are presented, informing future educational policy.

Analysis of Participation in Further and Higher Education Among Scottish Domiciled Students
E N D
Presentation Transcript
HE Statistics from SFC John Duffy
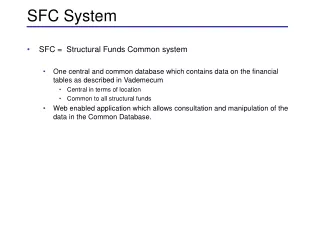
HE stats • SFC collections • Early Stats (aggregate) • Final figures (aggregate) • Other activity (previously called Minor Volume Indicators – data for research funding formulae) • Knowledge transfer metrics (unlikely to continue – data for KT funding formula)
HESA collections • Student record • Staff record • Finance record • DLHE surveys
Student record • Participation report • Retention report • PIs
Participation report • Post-compulsory school age participation • FES • HESA • Some school data from pupil census • Detailed geographical breakdown • Intermediate zones (rates are smoothed)
Retention report • Logistic regression analysis producing ‘expected values’ by subject and institution • Adjusted for qualifications, demographics etc • Cross-validation (excludes the institution and subject category data) • Compare with actual outcomes
PIs • Produced by HESA – ‘owned’ by HEFCE • Problems • Access PI - low participation based on UK levels and all entrants • NS-SEC PI – again based on all entrants • Scotland has few low-participation areas on a UK basis • 11% of all UK entrants in 2008-09 were from outside Scotland
Scottish domiciled students • Access PI based on SIMD and datazones • Most deprived 40% • Most deprived 20% • SEC PI • Entrants from elsewhere in the UK tend to be of higher social class than entrants from Scotland • PI for all young u/g entrants from SC 4 5 6 7 • UK 30.1 • Sc26.6 • Sc Sc dom 29.0
Lighter touch? • Not so far • One-off WARP collection • Entrants in 2008-09 • Did they come back in 2009-10? • Single collection • Replace Early Stats, HESA SR, Final figures • One retimed collection • Problem of divergence from UK system
Participation Report Zeg Ashraf SFC Statistics 26 March 2010
Aims • To summarise participation in FE and HE amongst Scottish domiciled 16+ year olds • Examine variation in participation by • geography • time • student subgroups • population subgroups
Data • FES Headcount derived by matching enrolments • HESA student records Students at UK HEIs • School pupil census (September) By age on 1st March State schools only
Exclusions • FE enrolments on non-funded courses • Students under 16 on 28th February But includes • Postgraduate students • College school link courses in FE • All FE students regardless of length of study
Calculating FTE’s HESA • with reference to a full-time, full-year student (1) FES • For comparability: • Full-time: 1 • Part-time: hours studied / expected hours for full-time course • Adjusted for non-completion
Missing postcodes • Data zones imputed for students with no valid postcode • Use matching characteristics related to home location • HESA – local authority and previous institution (1.2 %) • FES - local authority, campus, college (1.2 %)
Population estimation • Mid-year population estimates from GROS by datazone, age, gender • Students recorded at term-time address • As FES and HESA record students at home address, useful if population estimates can be ‘corrected’ to do the same.
Population estimation 2 • Two census tables used to adjust estimates: • CAS012 - the number of schoolchildren and students in full-time education living away from home in term-time. • T17 - the number of full-time students and schoolchildren in an area by their accommodation type.
Measuring participation • Rates in population • Student sub-groups • Age-gender standardised rates • Geographical comparisons • Standardised Participation Ratio (SPR): Observed / Expected if national rates applied • National SPR=1
Key findings from current report • the total number of individuals studying in college or university education has fallen between 2003-04 and 2007-08. • there is substantial geographical variation in levels of participation. Many areas that have relatively low participation in further education have relatively high participation in higher education, and vice versa • In college further education participation in the most deprived areas is 40 per cent higher than that in the less deprived in 2007-08 • In college and university higher education participation is higher for women than men in all age groups. In 2007-08, among those aged 16-20, 24 per cent of women were in higher education, compared with 19 per cent of men
Participation Report on SFC Website • www.sfc.ac.uk • Reports and Publications • Nov 2008 Next report (2004-05 to 2008-09) due in May 2010 Copies of Technical Report can be provided on request