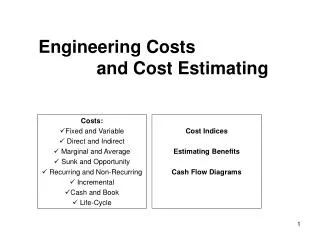
Session 9: Estimating Costs
Session 9: Estimating Costs. Agenda Homework Discussion Cost Resources Cost Trends Cost Estimating Cost Learning Curves Supply Chain Homework Assignment. Trough Capital Cost Estimate. Used ASPEN estimating software and Bechtel experience 250 MWe Plant with 3 hours of storage

Session 9: Estimating Costs
E N D
Presentation Transcript
Session 9: Estimating Costs Agenda Homework Discussion Cost Resources Cost Trends Cost Estimating Cost Learning Curves Supply Chain Homework Assignment
Trough Capital Cost Estimate • Used ASPEN estimating software and Bechtel experience • 250 MWe Plant with 3 hours of storage • 735 deg F reheat Rankine steam power block, 38% efficiency • Therminol HTF and Molten Salt storage • $3500/kWe (2005 dollars) Overnight Capital Cost • $4400/kWe (2011 dollars) Overnight Capital Cost
Cost Trends • Commercial Off-the-Shelf (COTS) leads to low cost • Development is amortized over the expected production run • High temperature metal alloys are expensive • Specialty items that are not part of the manufacturer’s main businessare often expensive and not always available • Costs vary with supply and demand • Quotes • ROM – Rough Order of Magnitude (+/- varies with supplier) • Quote good for a specific amount of time • Quote with inflation adjustments • Change orders
Cost Trends • Costs must be quoted in what year dollars • Costs can be adjusted for inflation using Marshall and Swift Index • Costs can be estimated from a quote at another size using a scalingexponent • If exponent not known, use 0.6
Engineering Cost Estimates Development Costs Production Costs • Project Management • Design • Testing • Documentation • Prototype • Factory • Tooling • Unit Production Cost (UPC) Partial Prototype Prototype Cost Learning Curve Unit Production Cost, nth Unit • Estimate • Vendor Quotes • Supplier Catalogs • Engineering Judgment • Labor Estimates • Estimate for UPC • Learning Curve and Prototype Cost • Vendor Quotes • Supplier Catalogs • Engineering Judgment • Actual Cost • Labor hrs and rates • Invoices • Actual Cost • Factory labor hrs and rates • Invoices
Simple Cost Estimating Formula C = Cr (S/Sr)m C = cost for size of item of interest Cr = reference case cost S = size of item of interest Sr = reference case size m = scaling exponent
Chemical Engineering Magazine Article
Adjusting for Inflation Cost at = Reference (Index at date of interest)__ Date of Cost (Index at date of reference cost) Interest • Consumer Price Index • Marshall and Swift
Learning Curves Interesting website Learning Curve Calculator: http://cost.jsc.nasa.gov/learn.html Aerospace 85% Shipbuilding 80-85% Complex machine tools for new models 75-85% Repetitive electronics manufacturing 90-95% Repetitive machining or punch-press operations 90-95% repetitive electrical operations 75-85% Repetitive welding operations 90% Raw materials 93-96% Purchased Parts 85-88%
1st Unit Cost Cumulative Cost (shaded area) Nth Unit Cost Unit Cost 1 Nth Unit Cumulative Units
Cost of Electricity (COE) Calculations • Cost of Electricity is expressed in $/kWh • COE = Fixed Charges + O&M Charges + Fuel Charges • Fixed Charges • Plant capital cost • Fixed charge rate • Capacity factor (equivalent % of year plant at rated capacity) • Rated capacity • O&M Charges (Operation & Maintenance) • Based on factored historical data • Fuel Charges • Fuel cost • Plant efficiency Source: The Cost of Energy from Utility-Owned Solar Electric Systems, 1976, ERDA/JPL-1012-76/3
Beginning of Life vs. Levelized COE Energy Cost, $/kWh LCOE COEo Beginning Operational Life End of Operational Life Time, years
Beginning of Life Cost of Electricity (COEO) • COEO = Fixed Charges + O&M Charges + Fuel Charges • Fixed Charges = (FCR * CI) / (RC * CF * 8760 hrs/year) • FCR = Fixed Charge Rate • Cost of Money • Taxes and Insurance • Depreciation • Working Capital • RC = Rated Capacity of plant in kW • CF = Capacity Factor = equivalent % of year plant operates at RC • CI = Capital cost on the first day of operation • O&M Charges (Operation & Maintenance) • Based on factored historical data • Fuel Charges = FCO * 3414 Btu/kWh / ηPP • FCO = Beginning of Life fuel cost in $/Btu • ηPP = Overall power plant efficiency
Example Problem for COEO • Given: A natural gas-fired combined gas turbine/steam power plant • Rated Capacity = 700 MWe Capital Investment = $1.875 Billion (2008 $s) • Capacity Factor = 0.70 Efficiency = 65% natural gas to bus bar • FCR = 18% Fuel Cost = $5/MMBtu • O&M = $ 0.010/kWh • Fixed Charges = (FCR * CI) / (RC * CF * 8760 hrs/year) • = (0.18 * $1.875 B *109/B)___________________ • (700 MWe * 1000kW/MW * 0.70 * 8760 hrs/year) • = $0.079/kWe • Fuel Charges = FCO * 3414 Btu/kWh / ηPP • = ( $5 MMBtu * 106/MM * 3413 Btu/kWh )/ 0.65 • = $0.026/kWh • COEo = 0.079 + 0.026 + 0.010 = 0.115 $/kWh
Levelized Cost of Electricity • Levelizes the inflationary effects of fuel and O&M costs over the life of the plant. • Fixed Charges – same as in COEO • Fuel Charges = (FCPV * 3413 Btu/kWh * CRFk,N ) / ηPP • FCPV = ((1 + if )/(k-if)) * [ 1 – ((1+if)/(1+k))^N] * FCO • CRFk,N = Capital Recovery Factor = k/[1-((1+k)^ -N)] • O&M = ((1 + iom )/(k-iom)) * [ 1 – ((1+iom)/(1+k))^N] * OMO Charges • Where: if = fuel inflation rate iom = O&M inflation rate • k = discount rate N = plant life in years
USA CSP Supply Chain • Fragmented • More variation than PV • Specialized components • Unclear demand for technologies • More components needed in pipeline • Need government support for US Market • Large up-front investment • Utilities under-value long-term value of storage
CSP Supply Chain Challenges • Reduce Costs • Higher production • R&D • Automated factories • Consolidated services • Ex. Flabeg glass mirrors—added field design, performance simulation, EPC management • Local Supply Chain • Benefits: reduced costs, increased communications and simplified logistics • Challenges: • Local expertise • Demand assurances • Government support policies
Source: G. Gereffi and K. Dubay, Greeneconomy, Chapter 4, Concentrating Solar Power, CGGC
Team Project: Costs and COEo • Your manager has just read a report on the status of power tower CSP with storage. Estimate the capital investment and COEo for the following assumptions: • FCR = 0.12 and 6 hours of storage • Location is Imperial Valley with peak insolation of 1000 Watts/square meter • Solar multiple is 2.7 • Capital cost of field is ________ $/square meter • Capital cost of remaining plant is $1500/kWe • Power block peak efficiency is 35% • O&M is 0.02 $/kWe • Draw a block diagram of the plant • Calculate the capital investment and COEo • Put your work on easel charts • Present your work to the class You have 15 minutes to prepare and 15 minutes for class presentations.