1 / 5

Figure 1. Study Flow-chart

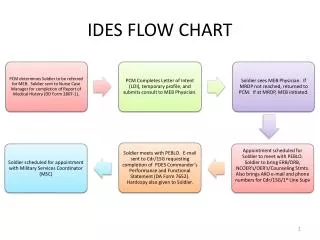
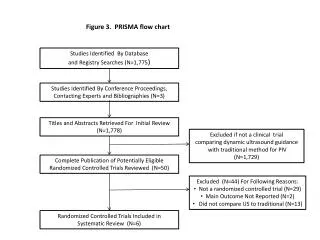
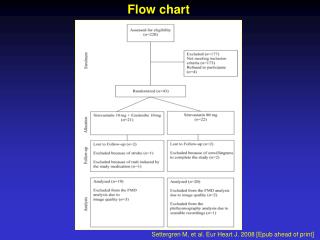
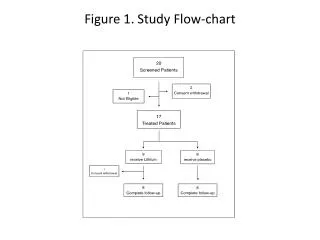
This study examines the relationship between lithium treatment and serum lithium levels, urinary osmolarity, as well as its effects on clinical scales such as the SARA and BDI-II. Figure 1 presents the research flow chart, while Figures 2 and 3 illustrate changes in lithium serum levels and urinary osmolarity throughout the trial. Figures 4 and 5 display results measured by the SARA and BDI-II scales, highlighting the significance of lithium dosage in managing mood disorders.

Télécharger la présentation

Figure 1. Study Flow-chart

An Image/Link below is provided (as is) to download presentation Download Policy: Content on the Website is provided to you AS IS for your information and personal use and may not be sold / licensed / shared on other websites without getting consent from its author. Content is provided to you AS IS for your information and personal use only. Download presentation by click this link. While downloading, if for some reason you are not able to download a presentation, the publisher may have deleted the file from their server. During download, if you can't get a presentation, the file might be deleted by the publisher.

E N D

More Related