Download
1 / 36
360 likes | 574 Vues
By Derek Menefee and Nathan Tompkins . Measuring the Changes of Anion Concentrations of Saliva. What is Saliva?. Saliva is produced in response to stimulation (usually taste) as well as movements of the jaw muscles, joints, and pressure from chewing.

E N D
By Derek Menefee and Nathan Tompkins Measuring the Changes of Anion Concentrations of Saliva
What is Saliva? • Saliva is produced in response to stimulation (usually taste) as well as movements of the jaw muscles, joints, and pressure from chewing. • It is produced mainly by three glands: the parotid, submandibular, and the sublingual. • Saliva controls the environment that the teeth are in, as well as protects against bacteria, and helps break down certain foods by using enzymes. • Saliva is made up mostly of water, electrolytes, mucus and enzymes.
What is Saliva Cont. • Contains 2 main enzymes: Amylase (starch breakdown) and maltase (maltose breakdown) • Saliva also contains bicarbonate, which acts as a pH buffer by neutralizing acid production and controlling plaque pH (Hogg, 2011).
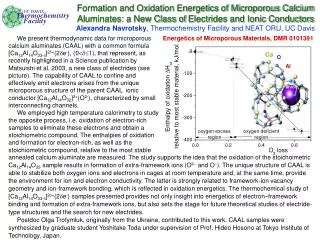
What is being tested and Why? • 1.) Human Salivary Anionic Analysis Using Ion Chromatography Z.F. Chen, B.W. Darvell and V.W. Leung - 10 subjects were tested and analyzed for pH of saliva after they have been fasting overnight. - Saliva samples looked for concentrations of chloride, phosphate, nitrate, sulfate, thiocyanate, and acetate were analyzed. Acetate ion was the most abundant ion in saliva samples with nitrate as the second most abundant. • 2.) Effectiveness In Learning Complex Problem Solving and Salivary Ion Indices of Psychological Stress and Activation P.Richter, J.W. Hinton, S. Reinhold -33 students were tested for samples of saliva fasting and a rest, and after being stressed after playing a challenging computer game for 2-3 hours. -Studies showed that a change in ion concentration (increase in potassium ion and decrease in sodium ion) in saliva occurred after psychologically stressful activity (Hinton, 1998).
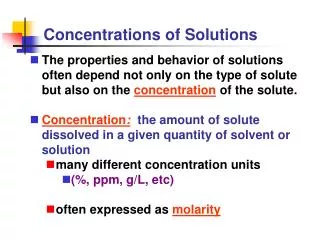
Our Experiment/Hypothesis • In this experiment, involving the use of Ion Chromatography, is testing the concentrations of ions in saliva during different stimuli and analyzing the changes (if any) that take place. • The hypothesis is that the different samples that may induce enzyme reactions, stimulation, and changes in pH change may also result in changes in ion concentrations in saliva after the sample is consumed. • Reference Instrument: Varian Inductively Coupled Plasma • Used to identify element intensities between saliva after fasting and after ingestion of sample.
Materials and Methods • Use of the Dionex ICS-90 instrument to run the samples of saliva • Parameters: -Pressure: at 890 Psi -Flow Rate: 1 mL/min -Pressure Gauge: 9 • 4 different experiments are run on the IC to determine ion concentration of saliva after different stimuli • Samples Used: 1.) Monster Energy Drink 2.) Protein/starch meal 3.) Vegetable/fruit meal 4.) Coffee (no sugar or milk added)
Materials and Methods Cont. • A sample of saliva is taken from the experimenter, who has been fasting for 10-12 hours prior to consuming food or drink. This is done so the saliva may be used as a control to compare with the sample analysis. • Experimenter must rinse with DI water before each sample is taken as to not induce any false readings from the sample itself, but only to obtain the salivary reaction to the sample. • 2 different samples are taken for each experiment (one from each experimenter). • A pH sample is also be taken before and after consuming to check for any differences. • The same procedure is also taken for the analysis of the ICP instrument.
Nate Fasting Day 1 Sample Nate Monster Sample Derek Fasting Day 1 Sample Derek Monster Sample
Derek Fasting Day 2 Derek Protein Saliva Sample
Nate Fasting Day 3 Sample Nate Vegetable Sample Derek Day 3 Fasting Sample
Derek Fruit Sample Derek Day 4 Fasting Sample Derek Coffee Sample
ICP RESULTS Nate Fasting Sample Nate Monster
Derek Fasting DerekMonster
Discussion of Results • In regards to the changes in ion concentration the only changes witnessed were due to the pH and protein samples. However the concentrations varied between the two different experimenters. • In the first Nathan fasting sample a nitrate peak of .002 ppm appeared at retention time 6.65 minutes. When the Nathan Monster Sample was run the nitrate peak vanished and a fluoride peak of .009 ppm appeared at retention time 3.17 minutes. • Derek’s phosphate group nearly doubled in height after drinking the Monster sample. • Derek’s protein also showed an increase in peak height an a concentration of 41.268 pmm • Average number peaks obtained by a sample was 8.3 • (lowest number being 6, highest number being 11) • ICP was used to look at the changes in element intensity. • The ICP data for “fasting” to “Monster” matched up with the same pattern of changes in the “fasting” to “Monster” data for the IC.
Changes in pH while testing • Standard “Fasting” pH for Derek : 6.5 • Standard “Fasting” pH for Nathan: 7.2 • pH of Monster being used: 3.5 • Monster Sample pH for Derek : 6.0 • Monster Sample pH for Nathan: 6.8 • All other sampling’s pHs only moved by .1 or by nothing at all.
Things that could be changed and Improved upon • Use a good 7 anion standard. • Have all the test subjects drink the same water while fasting. Most likely DI water. • Consume the same exact meals • Stress / sickness • Time restraints, waiting on the IC to warm up. Having time to run more samples on the ICP. Only running 4 samples a day. • Better Storage.
Future Research • More test subjects (to look at more samples, to see if there is more sample similarities. • do more test with varying pH’s , and use more sensitive pH tests. • Calculate the actual amount of time needed to produce a “fasting sample”. We could have run more than two samples a day, which would have saved on time. • Further speculation of different ions inducting thiocyanate and acetate.
Works Cited • Chen, Z.F., Darvell, B.W., Leung, V.W.H. Human saliva anionic analysis using ion chromatography. Archives of Oral Biology. (2004) Vol 49 (11). Pgs. 863-869. • Richter, P., Hinton, J.W., Reinhold, S. Effectiveness in learning complex problem solving and salivary ion indices in psychological stress and activation.International Journal of Psycology (1998). Vol 30 (3). Pgs. 329-337. • Hogg,Steve. Salivary Buffering, bicarbonate, and pH.The Oral Environment. (2011) http://www.ncl.ac.uk/dental/oralbiol/oralenv/tutorials/bicarbonate.htm • Kaufman, Eliaz., Lamster, I.B. Diagnostic Applications of Saliva-A Review.International and American Associations for Dental Research. (2002) Vol 13 (2). Pgs. 197-212.