Download
1 / 25
250 likes | 561 Vues
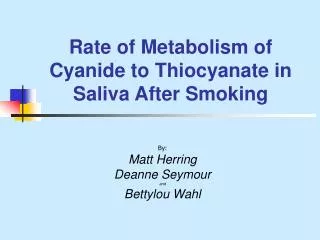
Determination of Saliva Thiocyanate Concentrations Using Spectrophotometric Analyses and its Correlation to Smoking. Alberto Juarez Chemistry 03.331 Instrumental Analysis Dr. Salim Diab Fall 2003. Introduction.

E N D
Determination of Saliva Thiocyanate Concentrations Using Spectrophotometric Analyses and its Correlation to Smoking Alberto Juarez Chemistry 03.331 Instrumental Analysis Dr. Salim Diab Fall 2003
Introduction • The assessment of the number of juveniles that smoke would be more effective with a quick and efficient chemical test rather than randomized surveys (Luepker et al. 1981). • Smoking has been shown to be a source of cyanide, which results in increased levels of thiocyanate that can be detected spectrophotometrically.
Intro: So what is Thiocyanate anyway? • Thiocyanate (SCN-) is the metabolite of cyanide. • end product of the detoxification of compounds containing cyanide • reaction catalyzed by the enzyme rhodanase • Rhodanase is produced by the mitochondria of living cells
The chemical reaction • Cyanide (CN-) reacts with thiosulfite (S-SO3-2) in a reaction catalyzed by rhodanase to form thiocyanate and sulfite ion (SO3-2) as presented below • CN- + S-SO3-2 SCN- + SO3-2
Do you have Thiocyanate in your system? • Well, yes • Thiocyanate is present in everybody’s saliva • This can only mean that we are exposed to cyanide everyday ;) • One source is FOOD (White et al. 1998) • includes but not limited to, cabbage, broccoli, almond, horseradish, corn, and manioc (cassava).
Another cyanide source is cigarette smoke (Luepkeer RV, et al 1981). • cyanide enters the body mainly through pulmonary absorption but also through the buccal and/or pharyngeal mucosal layers (Galanti 1997)
Purpose • The purpose of this experiment was to find whether or not smokers had statistically higher overall average [SCN-] than non-smokers, thus establishing a correlation between [SCN-] and smoking • Hypothesis • Smokinghigher [CN-]higher [SCN-]
Possible problems • Food containing cyanide may produce false-positive tests. • However it was found that saliva thiocyanate levels in non- and ex-smokers are not affected by alimentary sources (Galanti et al. 1997).
Methods • determination of thiocyanate concentrations through ultraviolet/visible (UV/Vis) radiation spectrophotometry (Lahti et al. 1999) • Method indirectly measures CN- • concentration of thiocyanatoiron ion (FeSCN2+) is determined • It has a deep-red color that absorbs maximally at =447nm.
The Thiocyanatoiron(III) ion Reaction • (remember) • CN- + S-SO3-2 SCN- + SO3-2 • thiocyanate (SCN-) reacts with ferric ions (Fe3+) to form thiocyanatoiron(III) ion (FeSCN2+) • Fe3+ (aq) + SCN- (aq) FeSCN2+ (aq)
When (Fe3+) is much greater than (SCN-) we can assume that all of (SCN-) is converted to (FeSCN2+) • thiocyanatoiron concentration [FeSCN2+] is equal to the original thiocyanate concentration [SCN-] • A standard curve was prepared to determine the molar extinction coefficient of [FeSCN2+]
Beer’s law, or the Beer-Lambert equation shown below. • A = abc or A = bc
sample size was around 2mL and placed in Eppendorf tubes • centrifuged at 12,000 rpm for 12 min • 200L portion of supernatant was reacted in 5mL of Fe(NO3)3 solution • %T at 447 nm was obtained with a UV/Vis spectrophotometer
non-smoker (N) mean [SCN-] • 2.053 X 10³ nmols • smokers (S) mean [SCN-] • 1.465 X 10³ nmols • differences in [SCN-] between the two groups was not significant • (P = 0.515).
Discussion and Conclusions • There is no difference in [SCN-] between smokers and non-smokers • May not be suitable test for determining juvenile smoking
The higher [SCN-] in non-smokers suggests there are other variable that affect [SCN-] • Alimentary sources do play a role • SCN- half-life may have an effect
Alimentary Cyanide Sources • Food is still a probable source • Cyanide concentrations in cassava result in health aberrations (White et al. 1998) • Conflicts with Galanti et al. (1997)
Role of SCN- half-life • It may be possible for a smoker to have normal [SCN-], if the analysis is done long enough after the last cigarette was smoked. • Saliva [SCN-] may rise significantly after smoking • after a certain amount of time the saliva [SCN-] is metabolized or excreted
However… • There are various reports on SCN- half-life • The shortest reported is 3 days • Smokers surveyed had smoked that same day • At most 2 hours prior to sampling • SCN- half-life is probably not a factor in this study
Flaws and Improvements • This study worked with a small sample size (n = 7 ) • due in part to people’s apprehension to donate saliva samples (there is something yucky about spiting into a vail : () • the non-smoker group should avoid foods that are known to contain CN- • and the time after smoking a cigarette should be recorded for smokers. • a timed study where [SCN-] is plotted against time after last cigarette
Other implications • spectrophotometric determination of salivary [SCN-] is sensitive • Could potentially be used as a preliminary determinant of cyanide or thiocyanate poisoning in forensic cases • Currently uses blood sampling
Acknowledgments • Dr. Salim Diab • Veronica Cardona • Brian Herbst • Hayden Hollister • Jessica J.
References Galanti LM. Specificity of salivary thiocyanate as marker of cigarette smoking is not affected by alimentary sources. Clin. Chem., 1997 Jan; 43(1):184-5. Lahti M, Vilpo J, Hovinen J. Spectrophotometric determination of thiocyanate in human saliva. J Chem Ed. 1999 Sept;76(9): 1281-3 Luepker RV, Pechacek TF, Murray DM, Johnson CA, Hund F, Jacobs DR. Saliva Thiocyanate: a chemical indicator of cigarette smoking in adolescents. Am J Public Health. 1981 Dec;71(12):1320-4. O S Oluwole, A O Onabolu, I A Cotgreave, H Rosling, A Persson, and H Link Incidence of endemic ataxic polyneuropathy and its relation to exposure to cyanide in a Nigerian communityJ. Neurol. Neurosurg. Psychiatry, Oct 2003; 74: 1417 - 1422. White WLB, Arias-Garzon DI, McMahon JM, and Richard T. Sayre Cyanogenesis in Cassava: The Role of Hydroxynitrile Lyase in Root Cyanide ProductionPlant Physiology, Apr 1998; 116: 1219 - 1225. Wood John L. and Edward F. Williams, Jr. THE METABOLISM OF THIOCYANATE IN THE RAT AND ITS INHIBITION BY PROPYLTHIOURACILJ. Biol. Chem., Jan 1949; 177: 59 - 67. http://www.acsu.buffalo.edu/~koudelka/kinetics/kineticsproblemset1answers.pdf http://www.rxlist.com/cgi/generic3/nitroprusside_cp.htm