Download
1 / 39
390 likes | 485 Vues
National Landscape for Children’s Hospitals Fall Forum Series September 12, 2012. Objectives – today’s discussion. Fundamentals Implications Strategy Children’s Hospital Association. Fundamentals. POPULATION. PAYORS. PROVIDERS. Fundamentals. POPULATION. PAYORS. PROVIDERS.

E N D
National Landscape for Children’s Hospitals Fall Forum Series September 12, 2012
Objectives – today’s discussion • Fundamentals • Implications • Strategy • Children’s Hospital Association
Fundamentals POPULATION PAYORS PROVIDERS
Fundamentals POPULATION PAYORS PROVIDERS
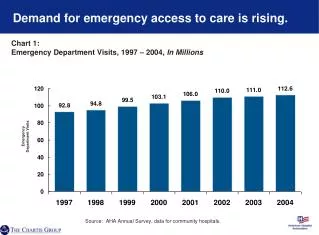
Population: Growth • U.S. children increasing from ~79 to ~89 million by 2022 • Million a year pace • More kids than the total population of any EU nation • Numbers of chronically ill children growing faster
Population: ExpectationsHow much life quality is “health care?” • A life at all…<1950s • Premature birth, polio, MM&R, congenital defects… • A better, longer life…1980-2000s • Allergies, attention, learning, comfort, convenience, mobility, motility, mood... • Perfection…2020 and beyond? • Genetic and pre-natal diagnoses and interventions… Population upshot – more demand
Fundamentals POPULATION PAYORS PROVIDERS
Providers: Supply • Pediatric subspecialists in short supply vs. demand • CHGME funds > 50% of training – to be cut back…away? • Physician practice shift from independent to employed practice models • Several major centers now “employ” 100% of subspecialty staff: Philadelphia, Boston, National, Cincinnati • Children’s hospital beds full; rising CMI and/or complexity • New hospital (project) costs running $2-4 million/bed Provider upshot – supply constraints
Fundamentals POPULATION PAYORS PROVIDERS
Payors: Multi-sponsor system All Population Commercial Medicare Medicaid Uninsured
Payors: Federal budget problem Federal Budget Surplus/ Deficit $200 B Surplus 0 Deficit (200) (400) (200) (800) ($1,000) FY1980 1985 1990 1995 2000 2005 2010 Note: Fiscal years end September 30 Sources: Congressional Budget Office: Office of Management and Budget
Payors: Political process More Conservative More Liberal Most liberal Republican senator Most conservative Democratic senator 1982 Source: National Journal, February 26, 2011
Concentration More Conservative More Liberal Most liberal Republican senator Most conservative Democratic senator 1982 1994 2002 Source: National Journal, February 26, 2011
Source: National Journal, February 26, 2011 Polarization More Conservative More Liberal Most liberal Republican senator Most conservative Democratic senator 1982 1994 2002 2010
Payors: Budget sequestration $1.2 trillion in automatic reductions FY 2013 9% across-the-board reductions FY 2014-2021 Cuts achieved through spending caps
Payors: State budget problems Total Estimated State Budget Shortfalls $0 2009 2010 2011 2012 ($50) Portion covered by states ($79) ($100) ($101) ($31) ($123) ($134) Portion offset by federal stimulus ($150) ($59) ($6) ($68) ($200) billion Sources: Center on Budget and Policy Priorities; Investment Company Institute
Payors: Medicaid managed care Medicaid Managed Care Penetration Rates by State: 2008 U.S. Average = 70% 0 - 50% (5 states) 51 - 70% (20 states including DC) 71 - 80% (9 states) 81 - 100% (17 states) Note: Unduplicated count. Includes managed care enrollees receiving comprehensive and limited benefits. Sources: Medicaid Managed Care Enrollment as of December 31, 2008. Centers for Medicare and Medicaid Services; Commonwealth Fund, Kaiser Family Foundation
Payors: Pricing focus Measures states are planning on taking to manage Medicaid expenditures in 2014 75% Tougher price negotiations w/ providers 73% More use of managed care 63% Tougher price negotiations w/ suppliers Restricting prescription drug formulary 57% Moving to bundled payments 56% 48% Moving to capitation 43% Dropping people from the program 5% Other Base: All State HCF Finance and PolicymakersSource: Strategic Health Perspectives 2011 State HC Finance and Policymakers Survey
Pediatrics uniquely at risk • Federal Medicaid cuts of $100M - $1B+ plus state cuts to worst payor in market • CHIP block grant reauthorization in 2014 unclear ... $10B+ • CHGME unauthorized and at risk ... $265M+ • DSH cut $17B+ under ACA by 2020 • Medicare voters outnumber child voters ~47 million to 0
Strategy: accountability ACCOUNTABILITY: The quality or state of being accountable; especially: an obligation or willingness to accept responsibility or to account for one’s actions HEALTH CARE TRANSLATION: Clinical success outcome vs. work/ service performed Defined price up front vs. “as incurred” costs Public reporting of results vs. non-disclosed transaction Next incarnation of the MCO (managed care organization)
Strategy: reform scenarios ACCOUNTABILITY Major Minor Major Super Systems We’re back ECONOMIC RECOVERY “Kalos orisate stin Ellada!” Minor Survival of the Fittest
Strategy vis-à-vis payors ABILITY TO BE ACCOUNTABLE Low High High “Manage population, money; reap gains” “Benevolent dictator or robber baron?” LEVERAGE vs PAYORS “Negotiate niches; win the ‘buy vs build’ war” Low “Bled to life support”
Models for pediatric accountability High Bundles Population Full PopulationSector Investment Pay-for-Perfor-mance DRG FFS Low Low High Financial Risk
Model strategy • Regional multi-payor environment = multi-model strategy • Pay-for-performance with a local commercial payor? • Bundle contracts with neighboring state Medicaid? • Population sector (0-18) with metro/regional HMO? • Population sector (complex/chronic) with Medicaid? • Own HMO product for local Medicaid populations? • “No regrets strategy” is an accountable provider panel
Accountability readiness: providers Low Readiness Level High
Strategy cornerstones -- 2020 • More accountability ‒ organize, measure, publicize • Demand exceeds supply ‒ success essential in the high reimbursement sectors of your market • More consumerism ‒ brand and product matter, think like a retailer! • More regionalization ‒ demand > supply = choose wisely! • Clinical-subspecialist access the key factor • “Have a bank” ‒ you can’t be too rich!
Challenge to the Association? • Federal Medicaid cuts of $100M - $1B+ plus state cuts to worst payor in market • CHIP block grant reauthorization in 2014 unclear ... $10B+ • CHGME unauthorized and at risk ... $265M+ • DSH cut $17B+ under ACA by 2020 • Medicare voters outnumber child voters ~47 million to 0 Reorganization and new strategy essential to our ability to support and advance our children’s hospitals
Children’s Hospital Association Mission • Advance child health through innovation in care, education and research with our children’s hospitals Focus • Drive public policy improving child health • Improve care delivery, quality and cost through collaboration • Inform awareness and solutions through information
Strategy • Extend the power of collaboration • World’s preeminent forum driving pediatric performance improvement, quality, and strategic leadership • Largest and most insightful pediatric analytics capabilities • Known and respected voice for children on the Hill • Recreate our operating organization • High end expertise, service, performance, value • Affordable and accessible to our children’s hospitals
Merger reorganization • Concluded both phases of organizational restructuring • Majority of operating costs and merger potential in staffing • Realized redundancy savings of over 30 positions • Streamlined executive positions by more than half • Completed GPO outsourcing per Novation contract • Achieved staff outsource of 17 positions • Redefined the Association from 250 to 200 staff • Merger related improvements of $5M+ annual expenses
Children’s Hospital Association organization Mark Wietecha Brian Humphreys David Bertoch Richard Stepanek David Spizman Amy Knight Marlene Miller Jim Kaufman Mark Riley • CHEX • Child advocacy • Communications • External • Internal • Member • Corporate relationships • Education • Executive Institute • Forums • Governance • Marketing • Member services • Quality strategy • Quality program development • National visibility – quality initiatives Federal affairs Outreach and mobilization Policy analysis 501c3 HR and facilities Cooperative HR and facilities Office operations 501c3 finance 501c6 finance Cooperative finance Analytics Data products Research & development Research & statistics Architecture IT Project management Systems infrastructure • BPI • CHND/PSO • Collaboratives (All) • Financial services • FOCUS Groups • Insurance services • QTN • Solutions • Supply Chain Services (SCS)
Policy results YTD Externally -- Patient care • Medicaid – exempted from the FY2013 Sequestration • Medicaid – pediatric sub-specialists included in the ACA Medicare rate package • TRICARE – legislation improving the system for children • Prescription Drug User Fee Authorization • Improve/extend Best Pharmaceuticals for Children Act, and the Pediatric Research Equity Act
Policy results YTD Externally – Education • CHGME – FY2013 appropriations supported by Senate and House at $265M+ • CHGME – Working for Reauthorization in Lame Duck Internally – Organization • Restructured our leadership team, Public Policy Committee of the Board, lobbying team
Business results YTD • Delivered our program plan FY2012 with strong user satisfaction, at or below budget while reorganizing • Improved returns to GPO participants • Patronage dividend up 50% from 2011 to FY2013 • Containing costs to hospital membership by reducing our expenses and reinvesting saving • Developingthe next generation of analytics supporting improved hospital operating performance • Merging and redeveloping PHIS, Case Mix, data products
FY2013 priorities Mission Focus • Drive public policy improving child health • Fundamental reformation of the system – how far? • Improve care delivery, quality and cost through collaboration • Align and deliver insight and innovation to our hospitals • Inform awareness and solutions through information • Greater visibility for “children” in media, on the Hill
Our Board, Your Reps Chair: James Mandell, MD Children’s Hospital BostonBoston, MA Vice Chair: Christopher J. Durovich Children’s Medical Center DallasDallas, TX Treasurer: Amy B. Mansue Children’s Specialized HospitalMountainside, NJ Secretary: Herman B. Gray, MD Children’s Hospital of MichiganDetroit, MI
Our Board, Your Reps Steve J. Allen, MD Nationwide Children’s Hospital Columbus, OH Christopher G. Dawes Lucile Packard Children’s Hospital at Stanford Palo Alto, CA Thomas D. Kmetz Kosair Children’s Hospital, Norton Healthcare, Inc. Louisville, KY James E. Shmerling, DHA, FACHE The Children’s Hospital Denver, CO
Our Board, Your Reps Marcy Doderer, FACHE CHRISTUS Santa Rosa Children’s Hospital San Antonio, TX Peggy Troy, RN, MSN Children’s Hospital of Wisconsin Milwaukee, WI Karen R. Wolfson Wolfson Children’s Hospital Jacksonville, FL Steve Worley Children’s Hospital New Orleans, LA
Alexandria Office: 401 Wythe Street Alexandria, VA 22314 Phone: 703-684-1355 Fax: 703-684-1589 Overland Park Office: 6803 W. 64th Street Overland Park, KS 66202 Phone: 913-262-1436 Fax: 913-262-1575