Download
1 / 31
310 likes | 491 Vues
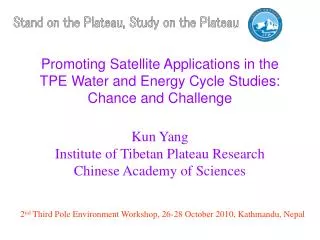
Stand on the Plateau, Study on the Plateau. Promoting Satellite Applications in the TPE Water and Energy Cycle Studies: Chance and Challenge Kun Yang In stitute of Tib etan Pl ateau Research Chinese Academy of Sciences.

E N D
Stand on the Plateau, Study on the Plateau Promoting Satellite Applications in the TPE Water and Energy Cycle Studies: Chance and ChallengeKun YangInstitute of Tibetan Plateau ResearchChinese Academy of Sciences 2nd Third Pole Environment Workshop, 26-28 October 2010, Kathmandu, Nepal
Lack of data in TP studies CMA stations Nearly no stations in west and > 4800 m
TP hydro-meteorological studies need • Radiation • Soil moisture • Land fluxes • Land surface temperature • Water vapor • Albedo • …… Need satellite products!
Verify satellite products before applied • Satellite products: usually developed, calibrated and validated in lowlands • TP represents an extreme • High elevation • Low air mass • Low aerosol • …… • TP providesan opportunity to validate a satellite product’s global applicability
Outline • Assessment of RS/DA products • Development of satellite products • Application of satellite products • Challenge of satellite applications
Outline • Assessment of RS/DA products • Radiation budget: GEWEX-SRB and ISCCP-FD • Water vapor: AIRS and MODIS • Albedo: MODIS • Development of satellite products • Application of satellite products • Challenge of satellite applications
Yang et al. (2006 GRL) GEWEX-SRB V2.5 under-estimates ~50 Wm-2 Partially due to neglect of elevation effects Shortwave Rad: Obs. vs GEWEX-SRB v2.5 Mean Rad
Mean bias in Rsw after accounting for elevation effects (Yang et al., 2008 JGR)
Longwave Rad: Obs. vs ISCCP-FD Yang et al. (2006 GRL)
Assessment of satellite water vapor JICA GPS network
Assessment of MODIS Precipitable Water Vapor 24 GPS Receivers All-sky Statistics Bias=mean(MOD-GPS) Std=Standard deviation RMSE= Root mean square error NRMSE= 100*RMSE/mean(GPS) Mean=mean(MOD) MaxDiff= Max(abs(MOD-GPS)) Cloudy Clear-sky (ByDr. Lv Ning )
For ground sites > 3000 m MOD-PWV assessment under clear-sky After Optimization Before Optimization We propose a formula to correct the large uncertainty for high-altitude regions (By Dr. Lv Ning )
AIRS-PWV assessment under clear-sky Qin et al. JMSJ, submitted
Outline • Assessment of satellite products • Development of satellite products • Soil moisture and land fluxes • Radiation • Application of satellite products • Challenge of satellite applications
Microwave Wsfc Tbobs LSM Tbsim Surface radiation Vegetation emission Tg, Tc, Wsfc RTE Vegetation layer Surface Microwave data assimilation TMI/AMSR/AMSR-E (6.9/10.6 and 18.7 GHz) Minimization scheme F(Tbobs-Tbsim) (Yang et al., 2007 JMSJ)
Validation at Tibet site (Yang et al., 2007 JMSJ)
Assessment of soil moisture estimate at a Mongolian site (Yang et al., 2009 JHM)
An example: 2003 Seasonality of distributed Bowen Ratio LDAS NCEP Compared to NCEP, LDAS shows a reasonable seasonal march and regional contrast between eastern Tibet and western Tibet
Outline • Assessment of satellite products • Development of satellite products • Application of satellite products • Tibet warming trend: elevation dependence • Atmospheric heating sources • Challenge of satellite data applications
Backgrounds This figure is adopted from Liu and Chen’s paper. They concluded “there exists a clear tendency of the surface temperature trends to increase generally as the site elevation rises “ by analyzing station data from nearly 0 m to 4800 m.
Warming rate above 5000 m ? 200m increment 500m increment Warming rate Warming rate Based on CMA data How warming rate depends on elevation?
MODIS station Can MODIS data show the warming dependence on elevation? (dz=500 m) MODIS Station Warming rate
4800m ? Warming rate derived from MODIS data (Qin et al., 2009)
Outline • Assessment of satellite products • Development of satellite products • Application of satellite products • Challenge of satellite applications • Validation issue: Scale match • Application issue: Accuracy
Cal/Val central Tibet site of SMOS and SMAP soil moisture 39 sets, starting on 30 July 2010 4500-4700 m Naqu Each SMTMS station: 4 levels 0-3 cm, 20 cm, 40 cm, 100m
Radiation accuracy for glacier and snow surfaces 1.27m / month Palong No.4 SE-Tibet mass and energy balance station
RS-estimated downward solar radiation Under-estimated by 100 Wm-2 (from 240 to 140), due to the difficulty to discriminate cloud and snow surface (Lu et al., 2010 JGR)
Summary • Satellite data are very helpful for understanding the status, processes, and modeling in this region • Need to improve the accuracy of satellite products and to develop new products for this region Thank you for your attention!