Download
1 / 36
360 likes | 522 Vues
Chpt. 3: Arrangement of Electrons in The Atom. Remember from Crookes experiment: when cathode rays (electrons) struck glass at far end of tube they caused it to glow it was the energy of the electrons that caused this glow. Bohr’s Study of Spectra (1920). through his study of

E N D
Remember from Crookes experiment: • when cathode rays (electrons) struck glass at far • end of tube they caused it to glow • it was the energy of the electrons that caused • this glow
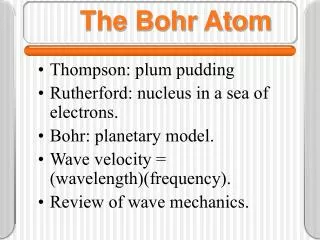
Bohr’s Study of Spectra (1920) • through his study of • spectra Niels Bohr • provided an insight into the • arrangement of electrons • inside the atom • Bohr’s Theory of the • structure of the atom was • based on the line spectra • produced when electrons • in an atom are excited by • heat or high voltage • currents
Understanding ‘Spectra’ Do you remember the spectrum of white light??? When white light is passed through a prism it is broken up into a array of colours – continuous spectrum from red to violet
Emission Line Spectrum of Excited Hydrogen Gas (Bohr’s experiment!!!) • Light from a hydrogen discharge tube (connected to • power supply) passed through a prism results in a • series of narrow lines
Spectrum produced is known as a emission line spectrum because: - it consists of lines (rather than being continuous ) - light is emitted when an electric current is passed through *hydrogen
Line Spectra of other elements *Note:each element has its own unique emission line spectrum e.g. like a fingerprint
Demonstration Viewing of emission spectra of elements using a spectroscope or a spectrometer *Note: Emission spectrometer instrument used to analyse materials for the presence of certain elements based on their line emission spectrum
Mandatory Experiment 1 To carry out flame tests with salts of lithium, sodium, potassium, barium, strontium and copper *Note: may also be phrased as test to identify a metal
Bohr realised that any model of the atom must explain two things: 1. why emission spectra of the elements are line spectra 2. why the emission spectrum of each element is unique to that element
Bohr’s Theory of Atomic Structure Bohr suggested a way to relate the emission line spectrum of hydrogen to the structure of an atom of hydrogen and it may be summarised as follows:
Electrons revolve around the nucleus in fixed paths called orbits • Electrons in any one orbit have a fixed amount of energy – orbits also known as *energy levels • As long as an electron is in any one particular energy level, it neither gains nor looses energy • 4. When atoms absorb energy, electrons jump from a lower energy level to a higher energy level • 5. Energy is lost when an electron falls from a higher energy level to a lower energy level • *The energy of the electron in a particular orbit (energy level) is fixed (quantised) at a definite value
Hydrogen Atom Energy absorbed when e- jumps from n = 1 to n = 2 energy level Orbit of energy E1 Orbit Of Energy E2 n = 1 n = 2 Energy emitted when e- falls from n = 2 to n = 1 energy level
An energy level: is defined as the fixed energy value that an electron in an atom may have. *Note: each energy level has a number, n, called the Principal Quantum Number
How are the lines of the emission line spectrum formed??? (Bohrs explanation for the existence of energy levels in atoms)
Excited State Spectrum n=4 Excited State n=3 Excited State unstable and drops back down UV Excited State But only as far as n = 2 this time n=2 Vi s ible • Energy released as a photon • Frequency proportional to energy drop IR n=1
Formation of lines of emission line spectrum • Electron normally in Ground State (lowest • energy level n = 1) • Energy supplied [ as heat or electricity] to atom • and the electron absorbs a certain amount of it • Electron jumps to higher energy level • Now in Excited State • Unstable therefore only a temporary state • Drops back to a lower level
Definite amount of energy that was absorbed • to make the jump up is now released as a • photon • Definite amount of energy emitted (photon) • appears as a line of particular colour in the • spectrum. Each colour corresponds to a • particular wavelength or frequency • Frequency depends on difference in energy • levels : • E2 - E1 = hf (E = hf) • h is Plank’s Constant, f is frequency of light, E is • energy of light emitted from atom
In conclusion since only definite amounts of • energy are emitted, this implies that electrons • can occupy only definite energy levels. Thus, • energy levels must exist in the atom • When electron falls to n = 1 level gives UV Range (Lyman Series) n = 2 level gives Visible Range (Balmer Series) n = 3,4 or 5 levels gives IR Range (Paschen Series)
Why has each element its own unique emisison line spectrum??? According to Bohr: Each element has a unique emission line spectrum because each element has a different number of electrons, and each element has its own arrangement of these electrons in different energy levels. As a result, the different electron transitions give rise to different emission spectra
Atomic Absorption Spectrometry • Atoms can also absorb light • If white light is passed through a gaseous sample of • an element, the light which comes out has certain • wavelengths missing i.e. dark lines will be seen in the • spectrum • Spectrum known as atomic absorption spectrum • Technique used by chemists to detect the presence of • certain elements and to measure the • concentration of these elements e.g. Analysis of • water for metals like lead and mercury
Energy Sublevels • Advances in spectrometer technology resulted in a • better understanding of energy levels • e.g. Sodium emission spectrum – single yellow line • actually two yellow lines very close together • Scientists proposed that each main energy level, except • the first, was made up of a number of sublevels all of • which were close in energy • Scientists discovered that number of sublevels in each • energy level corresponds to the value of n for the main • energy level i.e. • n = 2 2 sublevels • n = 3 3 sublevels • n = 4 4 sublevels
Sublevel of lowest energy – s • Next highest energy level – p • Next highest energy level – d • Highest energy level - f Energy Main energy level Sublevel
The Bohr model could explain the emission spectrum • of hydrogen and other 1 electron species e.g. He+, Li2+ • however, it could not accurately explain the emission • spectra of many electron atoms. • Our current view of the atom is based on QUANTUM • MECHANICS which builds upon the ideas of Bohr.
De Broglie – ‘Wave – Particle Duality’ (1924) • Louis De Broglie suggested • that all moving particles • (including electrons) which • have the properties of a • particle also have a wave • motion associated with them • If electron has a wave motion • then Bohr’s picture of it • travelling in a precise path at • a precise distance from the • nucleus cannot be true
Heisenberg – ‘Heisenberg’s Uncertainty Principle’ (1925) • Werner Heisenberg used • mathematics to confirm De • Broglie’s theory. • He came up with a very • famous principle • ‘Heisenberg’s Uncertainty • principle’: • ‘ it is impossible to measure at the same time both the velocity and the position of an electron’
Heisenberg Vs. Bohr Bohr’s model - electrons moving with certain speed in orbits of fixed distances from the nucleus. Heisenberg disputed this model stating that you cannot measure the speed of the electron and its distance from the nucleus at the same time. * Electron is not travelling in a fixed path therefore can now only talk about the probability of finding it at a particular position inside the atom.
Atomic Orbitals An *orbital: is a region in space within which there is a high probability of finding an electron *Note: do not mix up orbital with Bohr’s term orbit
Schrödinger (1926) • Erwin Schrödinger • devised WAVE • EQUATION to work out • probability of finding an • electron in any particular • sublevel in an atom • These equations were • used to predict the • shape of the s, p, d,& f • orbitals
Types of Orbitals s Orbital p Orbital d Orbital
p Orbitals • This is a p sublevel with 3 orbitalsthese are called: • x, y & z • p orbitals are dumb-bell shaped and only differ in their • orientation in space
d orbitals = complex shapes (5 orbitals) f orbitals = complex shapes *Note:A sublevel is a subdivision of the main energy level made up of one or more orbitals of the same energy level.
Arrangement of Electrons in Atoms Electrons in atoms are arranged as LEVELS (n) SUBLEVELS ORBITALS ELECTRONS