Predictive Methods Using Protein Sequences Unit 23
Predictive Methods Using Protein Sequences Unit 23. BIOL221T : Advanced Bioinformatics for Biotechnology. Irene Gabashvili, PhD. Introduction. Each protein starts its life as a shapeless string of amino acids – more exactly, residues Primary > Secondary > 3D Structure

Predictive Methods Using Protein Sequences Unit 23
E N D
Presentation Transcript
Predictive Methods Using Protein SequencesUnit 23 BIOL221T: Advanced Bioinformatics for Biotechnology Irene Gabashvili, PhD
Introduction Each protein starts its life as a shapeless string of amino acids – more exactly, residues Primary > Secondary > 3D Structure Function depends on 3D structure 3D structure can be “guessed” from Sequence, but more info is needed – folding environment, chaperonines, etc Partial structural predictions can be also helpful
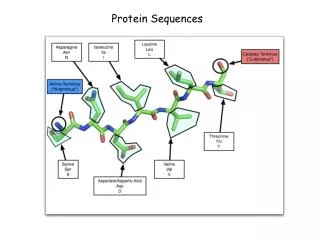
Amino Acid versus Residue R R C C N CO H2N COOH H H H Amino Acid Residue --- next lecture: all on structures ---
From previous lecture: • Often, it’s enough to knowing the sequence of the first 6 amino acids to identify the protein • “Terminal sequence identification” approach: a “label” (“backpack”) is chemically attached to the end. • label-AA1-AA2- …Aan • label-AA1 • label-AA1-AA2-AA3 • …
Riptide Sequencing Algorithm Riptide Algorithm (D.Carter et al) Mass spec data from an unknown protein label M label+ MQ label+ MQI label+ MQIF label+ Occurrence counts MQIFV label+ Terminal Amino Acid Sequence Prediction, e.g.MQIFVK MQIFVK label+ massF mass/charge (e.g. protein shown is ubiquitin whose amino acid sequence starts fromMQIFVK…) See e.g., >gi|37571|emb|CAA44911.1| ubiquitin [Homo sapiens]
Calculates a score value for each of the 203 amino acid sequences in a nested loop fashion. Suppose there are only 3 amino acids (0, 1 and 2) with masses m0, m1 and m2 (33= 27 permutations), no attached label. For the x-y-z sequence, the scoring function rewards the presence of the likely molecular fragments x, x-y and x-y-z. do x = 0 to 2 do y = 0 to 2 do z = 0 to 2 Pxyz = MS(mx) + MS(mx+my) + MS(mx +my+mz) The sequence generating the highest scoring Pxyz is reported as the most likely sequence for the unknown protein. Simple algorithm
Crash course on biostatistics Statistics – analyzing data sets in terms of the relationships between the individual points Variance & Standard Deviation; Co-variance Machine Learning approaches (supervised & unsupervised) Clustering vsClassificaion, PCA P-values & E-values, Scores via False positives, negatives
PCA • principal components analysis (PCA) is a technique that can be used to simplify a dataset • It is a linear transformation that chooses a new coordinate system for the data set such that • greatest variance by any projection of the data set comes to lie on the first axis (then called the first principal component), • the second greatest variance on the second axis, and so on. • PCA can be used for reducing dimensionality by eliminating the later principal components. • Applications: face recognition, patterns findings
What is Cluster Analysis? • Cluster: a collection of data objects • Similar to the objects in the same cluster (Intraclass similarity) • Dissimilar to the objects in other clusters (Interclass dissimilarity) • Cluster analysis • Statistical method for grouping a set of data objects into clusters • A good clustering method produces high quality clusters with high intraclass similarity and low interclass similarity • Clustering is unsupervised classification • Can be a stand-alone tool or as a preprocessing step for other algorithms
Group objects according to their similarity Cluster: a set of objects that are similar to each other and separated from the other objects. Example: green/ red data points were generated from two different normal distributions
K-Means Clustering • The meaning of ‘K-means’ • Why it is called ‘K-means’ clustering: K points are used to represent the clustering result; each point corresponds to the centre (mean) of a cluster • Each point is assigned to the cluster with the closest center point • The number K, must be specified • Basic algorithm
10 9 8 7 6 5 4 3 10 2 9 1 8 0 7 0 1 2 3 4 5 6 7 8 9 10 6 5 Update the cluster means Assign each objects to most similar center 4 3 2 1 0 0 1 2 3 4 5 6 7 8 9 10 reassign reassign K=2 Arbitrarily choose K object as initial cluster center Update the cluster means K-means clustering
Step 0 Step 1 Step 2 Step 3 Step 4 a a b b a b c d e c c d e d d e e Step 3 Step 2 Step 1 Step 0 Step 4 Hierarchical clustering Protocol • Calculate pairwise distance matrix • Find the two most similar genes or clusters • Merge the two selected clusters to produce a new cluster • Calculate pairwise distance matrix involving the new cluster • Repeat steps 2-4 until all objects are in one cluster • The clustering sequence is represented by a hierarchical tree – dendrogram.
(M)ANOVA • The analysis of variance technique in One-Way Analysis of Variance (ANOVA) takes a set of grouped data and determine whether the mean of a variable differs significantly between groups • Often there are multiple variables and you are interested in determining whether the entire set of means is different from one group to the next • There is a multivariate version of analysis of variance that can address that problem (MANOVA)
NCI: (Srinivas et Sirvastava., Cancer Biomarker Research Group, review article, Vol. 8, 1160-69, 2002) Biomarkers are biological molecules that are indicators of physiologic state and also change during a disease process. The utility of a biomarker lies in its ability to provide an early indication of a disease, to monitor disease progression, to provide ease of detection, and to provide a factor measurable across populations. What is a Biomarker?
What Types of Biomarkers Exist? • Genomic • DNA (e.g., BRCA-I gene mutations) • RNA (gene expression, up/down regulation) • Proteomic • Peptides (e.g., PIF) • Proteins (e.g., HER2/neu, PSA, CA-125) • Metabonomic • Small molecules, metabolites (e.g., glucose, cholesterol, cortisol) MS-based
Bioinformatics tools can predict: Secondary Structure 3D Structure Interaction Sites Solvent Accessibility Transmembrane Segments Subcellular Localization Function
What Can Be Predicted? • O-Glycosylation Sites • Phosphorylation Sites • Protease Cut Sites • Nuclear Targeting Sites • Mitochondrial Target Sites • Chloroplast Target Sites • Signal Sequences • Signal Sequence Cleav. • Peroxisome Target Sites • ER Targeting Sites • Transmembrane Sites • Tyrosine Sulfation Sites • GPInositol Anchor Sites • PEST sites • Coil-Coil Sites • T-Cell/MHC Epitopes • Protein Lifetime • And a lot more….
Sequence Feature Servers • T-Cell Epitope Prediction – no longer exists • http://syfpeithi.bmi-heidelberg.com/scripts/MHCServer.dll/home.htm • B cell epitope prediction from 3D structures: • http://www.cbs.dtu.dk/services/DiscoTope/ • Predictions of promiscous MHCI-restricted epitopes: • http://immunax.dfci.harvard.edu/PEPVAC/ • O-Glycosylation Prediction • http://www.cbs.dtu.dk/services/NetOGlyc/ • Phosphorylation Prediction • http://www.cbs.dtu.dk/services/NetPhos/
Secondary Structure PHDsec: http://www.predictprotein.org Workbench: http://workbench.sdsc.edu/ NGWB: www.ngbw.org PROFsec: http://cubic.bioc.columbia.edu/predictprotein/ PSIPRED (http://bioinf.cs.ucl.ac.uk/psipred/ ) Jpred(http://www.compbio.dundee.ac.uk/~www-jpred/)
History of secondary structure prediction: The 1st generation: physicochemical principles, expert rules, and statistics (1970s, 50% accuracy) The 2nd generation methods: sliding window that walked through the entire sequence. (1980s into the 1990s, ~60% accuracy). The 3rd generation methods use multiple sequence alignments, take advantage of the evolutionary information (~75% accuracy).
Tutorials/Description: PredictProtein : sequence analysis, prediction of protein function and structure The PredictProtein Server. Nucleic Acids Research 32(Web Server issue):W321-W326.
Interaction sites http://cubic.bioc.columbia.edu/services/ See also: http://bioinformatics.ca/links_directory/narweb2007/ (same for 2006-2003) http://gemdock.life.nctu.edu.tw/3D-partner/vers1/index.php (predicts interaction partners) http://ef-site.hgc.jp/eF-seek/index.jsp
Solvent Accessibility PHDacc (http://www.predictprotein.org/ PROFacc (http://cubic.bioc.columbia.edu/predictprotein/ ) Jpred (http://www.compbio.dundee.ac.uk/~www-jpred/ )
Transmembrane Segments • TopPred (http://bioweb.pasteur.fr/seqanal/interfaces/toppred.html ) • TMHMM (http://www.cbs.dtu.dk/services/TMHMM/ ) • Membrane Helix Prediction • http://www.cbs.dtu.dk/services/TMHMM-2.0/
Subcellular Localization PSORT: http://psort.ims.u-tokyo.ac.jp/ TargetP: http://www.cbs.dtu.dk/services/TargetP/ http://cubic.bioc.columbia.edu/db/LOC3d/index.html