Download
1 / 14
140 likes | 275 Vues
This document details the comprehensive simulations conducted using eight stations of micro-strip detectors equipped for high-density tracking in a high-collision-rate environment. It highlights the design features, including low mass, full azimuthal and polar angle coverage, and optimized sensor configurations for reduced occupancy. The study encompasses noise characteristics, hit-finding efficiency, and the resulting performance metrics under various scenarios, providing insights into detector response and reconstruction capabilities. Key software tools for ideal and real reconstruction are discussed for effective data analysis.

E N D
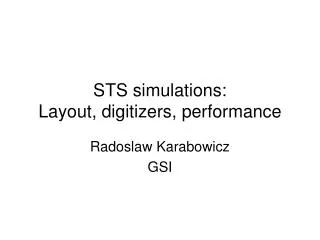
Anna Kotynia STS SIMULATIONS
8 stations fully based on micro-strip detectors STS Detector Tracking detector: -low-mass detector -full azimuthalangle coverage -polar angle coverage:from 2.5°to 25° -high track density in the inner-most region -high collision rate-vertical magnetic field
SECTORS & MODULES Sensors: ● 300μm thick, ● 6cm wide , ● 2÷6 cm high Different z-position of each sensor; -> Outer regions coveredby larger sensors, oreven chainedsensors(1÷3 sensors in onesector), to minimizenumber of channels -> Small sensors in the inner region to reduce the occupancy;
7,5° front stereo angle & -7,5° back stereo angle STRIPS
Hit FindingEfficiency RESULTS
RESULTS C.D. Strip occupancy Hit density
all — all tracks, that are in acceptance. 8 sens — there were no gap and no overlap. 7 sens — there was 1 gap 6 sens — 2 gaps 9 sens — 1 overlap 10 sens — 2 overlaps 1 gap, 1 overlap — it is easy to understand
Signal: • 80e-/mm • (24000e- for 300mm silicon) • Noise: • 0.8 pF/cm in cables • ~1.5 pF/cm in sensors n-XYTER: fast: 26.9e/pF+200e slow: 12.7e/pF+233e EXAMPLE: 2cm sensor+30cm cable=>926e/576e 16cm sensor+ 3cm cable=>911e/569e Noise Calculations ADC signal on front strips ADC signal onback strips
DETECTOR RESPONCE Cluster width all 1 channel 2 channels 3 channels 4 channels 5 channels >5 channels Gaus Noise Threshold @ 8 Signal peak height [a.u.~1ke-]
Θ distribution in Au+Au central collision@ 25AGeV RESULTS Distance from the y-axis tothe outer regions of station
Software download source: • svn co https://subversions.gsi.de/fairroot/cbmroot/trunk • Ideal reconstruction: sts_reco.C • Real reconstruction: sts_reco_real.C • Geometry file: • sts_Standard_s3055AAFK5.SecD.geo • Parameters file: • sts_Standard_s3055AAFK5.SecD.digi.parsts_Standard_s3055AAFK5.SecD.7vs7.digi.par STS software status