European Ad Spend Growth Trends 2010
Discover the advertising expenditure trends in Europe for various media types and macro-sectors in 2010. This report from The Nielsen Company covers ad spend statistics for major European countries and sectors. Gain valuable insights into the changing landscape of advertising trends.

European Ad Spend Growth Trends 2010
E N D
Presentation Transcript
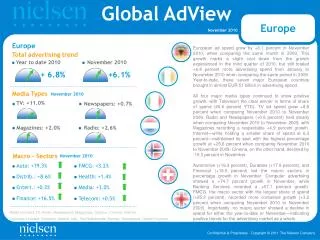
Europe Europe European ad spend grew by +6.1 percent in November 2010, when comparing the same month in 2009. This growth marks a slight cool down from the growth experienced in the third quarter of 2010, but still totaled +6.8 percent more advertising spend from January to November 2010 when comparing the same period in 2009. Year-to-date, these seven major European countries brought in almost EUR 51 billion in advertising spend. All four major media types continued to show positive growth, with Television the clear winner in terms of share of spend (45.6 percent YTD). TV ad spend grew +8.8 percent when comparing November 2010 to November 2009. Radio and Newspapers (+0.6 percent) held steady when comparing November 2010 to November 2009, with Magazines recording a respectable +4.9 percent growth. Internet—while holding a smaller share of spend at 6.3 percent—maintained its spot with the highest percentage growth at +26.6 percent when comparing November 2010 to November 2009. Cinema, on the other hand, declined by -15.3 percent in November. Automotive (+19.3 percent), Durables (+17.8 percent), and Financial (+16.5 percent) led the macro sectors in percentage growth in November. Computer advertising showed a +74.7 percent growth in November, while Banking Services recorded a +67.1 percent growth. FMCG, the macro sector with the largest share of spend (+25.3 percent), recorded more contained growth (+3.2 percent when comparing November 2010 to November 2009). Importantly, no macro sector showed a decline in spend for either the year-to-date or November—indicating positive trends for the advertising market as a whole. Total advertising trend Year to date 2010 November 2010 + 6.8% +6.1% Media Types November 2010 TV: +11.0% Newspapers: +0.7% Magazines: +2.0% Radio: +2.6% Macro - Sectors November 2010 Auto: +19.3% FMCG: +3.2% Distrib.: +8.6% Health: +1.4% Entert.: +0.3% Media: +3.0% Finance: +16.5% Telecom: +0.5% Media included: TV, Radio, Newspapers, Magazines, Outdoor, Cinema, Internet. Countries included: Germany, Ireland, Italy, The Netherlands, Norway, Switzerland, United Kingdom.
TV Magazines Newspapers Radio Europe Total advertising trend Media -- % Share of Spend -- YTD Market -- Advertising Expenditure Trend (Million €) Media -- % change YTD and last month 2010 Outdoor Cinema Internet 2009 Market -- Year on year % change by month Sectors -- % change YTD and last month Sectors -- % Share of Spend -- YTD 2010 Telecom. Automotive Clothing & Access Distribution Durables Entertainment Financial FMCG Healthcare Industry & Serv. Media 2009 Media included: TV, Radio, Newspapers, Magazines, Outdoor, Cinema, Internet. Countries included: Germany, Ireland, Italy, The Netherlands, Norway, Switzerland, United Kingdom.
Methodology notes This report is run by The Nielsen Company, Media Group, Global AdView and reports on advertising expenditure for Germany, Ireland, Italy, The Netherlands, Norway, Switzerland, United Kingdom. The source of information for all data included in the report is The Nielsen Company, Media Group*. All figures are gross with the exception of Italy, for which they are estimated using the official weighting factors provided by The Nielsen Company, Media Group, Italy. Figures are reported in million Euros. This report includes spend on the following media types: TV, Newspaper, Magazines, Radio, Outdoor, Cinema Macro-sectors include the following Categories: • Automotive: Automotive • Industry & Services: Business Services, Property, Institutions, Power & Water • Clothing & Accessories: Clothing & Accessories • FMCG: Cosmetics & Toiletries, Drinks, Food, Housekeeping Products, Tobacco • Distribution Channels: Distribution Channels • Durables: Domestic appliances, Furnishings & Decoration, Information Technology • Entertainment: Entertainment, Leisure products, Transport & Tourism • Financial: Financial • Healthcare: Healthcare • Media: Media & Publishing • Telecommunications: Telecommunications * Switzerland in association with Media Focus
Aboutnielsen ContactsE-mail:globaladview@nielsen.com Global AdView Nielsen Global AdView provides international advertising information services and provides clients with intelligence on how their competitors are spending, and creative activity, in more than 80 countries, along with a deep and complete knowledge of local market advertising trends. Spend and creative content can be compiled, linked and harmonized at category and product level to enable quick strategic insight into competitive activity. Media Group One of the major businesses of The Nielsen Company, the Media Group is active in 40 markets offering television, radio and outdoor audience measurement, print readership, advertising information services and customized media research. The Media Group of The Nielsen Company is the recognized market standard for media information in the largest advertising territories. Thanks to the local presence of our own branches in more than 20 of the world’s leading advertising markets (including North America, Europe, Asia Pacific and Africa) we can measure expenditure and creatives daily, providing an always open window on the world of media. The Nielsen Company The Nielsen Company is a global information and media company with leading market positions in marketing and consumer information, television and other media measurement, online intelligence, mobile measurement, trade shows and business publications. The privately held company is active in approximately 100 countries, with headquarters in New York, USA. For more information, please visit, www.nielsen.com.