Download
1 / 28
280 likes | 292 Vues
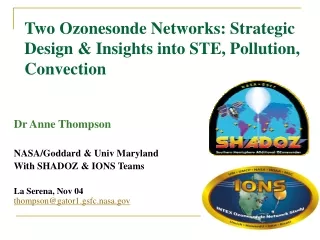
This presentation discusses the design and analysis of two Ozonesonde networks, SHADOZ and IONS, focusing on topics such as pollution, convection, and the measurement of tropospheric ozone. It also addresses important science questions and provides a roadmap for future research.

E N D
Two Ozonesonde Networks: Strategic Design & Insights into STE, Pollution, Convection Dr Anne Thompson NASA/Goddard & Univ Maryland With SHADOZ & IONS Teams La Serena, Nov 04 thompson@gator1.gsfc.nasa.gov
Road Map for Presentation Thank You L Gallardo (U Chile); A Cordova (U La Serena) Review O3 “Science Questions,” definitions Discuss Design of Networks and Principal Analyses > SHADOZ – 1998- Variability in tropospheric ozone (compare Easter Is analysis [J Quintana]) STE, Tropical Tropopause Layer (“TTL”) “Atlantic Paradox” need more NH stations > IONS – July-August 2004 Sondes in North American-Europe “ICARTT” Mid-latitude STE in “Summer That Wasn’t” Visit Ozone Sites – Review Techniques, WMO Guidelines
QUESTIONS MOTIVATING SHADOZ O3 & Measurement Strategy Begun in 1998 > Tropical Questions SHADOZ network 1. Are ozone satellite columns accurate? √ High resolution, stratosphere and troposphere i.e. Soundings 2. Where is wave-one pattern observed in total equatorial ozone [Shiotani, 1992]? √ 3. Which chemical-meteorological interactions govern ozone variability? Burning? Lightning? Urban? STE? Long-range transport? Time scale? √
TROPOSPHERIC OZONE UNITSMixing ratio, ppbv; pollution > ~25 ppbv, 0 km Column-integrated, DU; pollution > 25-30 DUPpmv – stratosphere; Total ozone w/ SBUVFree Trop = Climate, Long-range Impact BL = “Smog”
SHADOZ PROJECT (Southern Hemisphere Additional Ozonesondes) • Operations in southern hemisphere (1998), then add two NH • Now > 2200 ozone profiles: http://croc.gsfc.nasa.gov/shadoz. Refer to Thompson et al, JGR, 108, 8238, doi: 10.129/ 2001JD000967, 2003
Ozonesonde Training Pre-conditioning • Check Instrument Function • Simulate High Ozone • Environments • Determine Ozone Recovery • Store for Use 3-7 days Day-of-Prep 24 h. Launch Baby-sit Disperse Info
Ozonesonde Training Pre-conditioning • Freshen Solutions • Obtain Experimental • Parameters: • -Ozone BG • -Flow Rate • Package for Launch 3-7 days Day-of-Prep 24 h. Launch Vaisala - Transmitter - Humidity - Altitude - Pressure - Temperature Baby-sit Disperse Info Ozonesonde
√ Wave-One in Tropospheric Ozone, Stratospheric Ozone Longitudinally Invariant – Interaction of General Circulation, Convection + O3 from Fires, Lightning (via NO) • Unique SHADOZ view shows wave • present all year • (Thompson et al, JGR, 108, D2, 8241 2002JD002241, 2003). Convective influence over western Pacific, subsidence over Atlantic
√ Week-to-weekvariability, Nairobi: Low ozone in free troposphere (left, blue) coincides with convection & Indian Ocean Transport (higher humidity, right, red). • Wavelet, other statistics (Thompson, Chatfield) show distinct 3-7-day periodicity from convection, advection
Nairobi, 1998-2001-Seasonal “Means?” • Tropospheric column ozone • is higher in S-O-N than M-A-M, • but extremes are similar • “Meaningless means” • From Thompson et al [Bull. Am. • Meteor. Soc., 2004] • - Cf Variability defined by • synoptic regime [Diab et al., • Atmos. Chem. Phys., 2003; JGR, 2004].
Profile Classification: Two DJF patterns at Irene, So. Africa *** • Search for pattern and order. • Multivariate cluster analyses technique • Profiles group according to magnitude and altitude of ozone • Highlight need to account for temporal variability, I.e. stratification? *** Diab et al., Atmos. Chem. Phys., 3, 713-723, 2003
GEOGRAPHICAL VARIABILITY • From 1998-2002 data: • (a) La Reunion – more stratospheric • influence; African biomass burning • Natal – M-A-M convective influence; • SON – biomass burning impact • Fiji – pronounced convective in- • fluence, SON – imported pollution
Atlantic “Ozone Paradox” • “Paradox” (left) – more DJF ozone over southern hemisphere when north tropics (west Africa) burning! Thompson et al. [2000] • Mechanisms: Interhemispheric transport, subsidence of ozone over So. Atlantic (middle), lightning (right) • How much of each?
Re-evaluate SHADOZ (2004): New Findings, Network Adequate? • Paramaribo (Surinam, 5N) O3 differs from SH O3 [Peters et al., 2004] • “Atlantic Paradox” [Thompson et al., 2000] does not occur over African continent near fires [Sauvage et al., 2004] • At all SHADOZ sites, distinct 3-7-day periodicity weekly sampling ok; 2/week better; 2/month inadequate
Define Mid-Latitude Ozone Requirements • PART 1: O3 & Measurement Strategies in 2 networks • > Mid-Latitude Questions IONS network • Can O3 pollution be followed during ICARTT? • What are O3 transport patterns across NA? • How much Asian O3 reaches western NA? • Can O3 formation, transport in high pollution be: • Quantified? Predicted? Measured from satellite? • INTEX (Intercontinental Transport Expt) NA Questions IONS network
IONS – 2004: (INTEX Ozonesonde Network Study) Design Responses • West Coast for Asian O3 . • Back trajectories show central US/Canada cause eastern outflow (MI, TO). • SC to NE US/maritimes flow (8 stations & R H Brown) • Frequency: Daily preferred, min. 3/week. • Operated 6 weeks, July-August 2004.
IONS – 2004: (INTEX Ozonesonde Network Study) Strategic Design • Leverage funding: NOAA, NASA, EC-MSC, universities (Rice, Howard, UMCP, UAH, URI, UVA) • Daily, centralized archiving (GSFC, Ames) “whole > sum of parts” • Enhancement with forecast trajectories allows • Lagrangian flight planning • Launch, flight coordination
1. Can O3 pollution be followed during ICARTT? √Lagrangian Operational Design Ozone at 500 hPa from Beltsville predicted to arrive at RH Brown two days later, and did so.
2. What are O3 transport patterns across NA? √ Lagrangian analysis • Anomaly: “The Summer that Wasn’t” • Note! Peaks on 21/7 WFF/Beltsville/RI/R H Brown/NS due to stratospheric ozone. Pollution underneath? • Ozone “budget” to be computed from meteorological analyses, sonde profiles, aircraft and satellite ozone data.
3. How much Asian O3 reaches western NA? √ • 21/7 example shows some of O3 pollution from Asia. • Longer back-trajectories to be run, based on kinematic Schoeberl model & GMAO GEOS-4. • Further analysis will use met. fields (RDF-pv, pot. Temp).
3. How much Asian Pollution Reaches West Coast? √ Impact of STE:O3 STE-Pollution Mixture, 500-150 hPa 1st August. Analyzes with INTEX GMAO fields: <http://croc.gsfc.nasa.gov/intex>
4. Can O3 formation & transport in high pollution be: Measured from satellite? Quantified? Predicted?√ Ronald H. Brown: July 16, 2004 Ronald H. Brown: July 17, 2004 Ronald H. Brown: July 18, 2004 Satellite measurements of pollution ozone need accurate tropopause, discrimination of stratopsheric, tropospheric UT/LS segments. IONS-2004: Mid-latitude UT/LS ozone hard to resolve even with soundings.
Can Ozone in High Pollution be Quantified? Predicted? Test Assimilation √ • TOMS satellite ozone in Regional Air Quality Model System (B Pierce, NASA-LaRC) 8 July Ron Brown Sounding & RAQMS • Lower tropospheric (LT) ozone and UT/LS not correct • Will IONS assimilation improve agreement? • Give better tropospheric ozone from satellite? • Predict pollution transport?
Summary O3 & Measurement Strategy Design > Tropical Questions SHADOZ network > Mid-latitude Questions IONS (2004) • Spatial, temporal resolution in network must match scientific question (for O3,, scales of dominant meteorological processes) • Regional-to-global scale of tropical issues define SHADOZ (~12 global sites, 1/wk) • Urban-to-regional mid-latitude pollution defines IONS & addresses ICARTT needs(~12 US/Can. sites, 1/day) Analyses require multiple statistical, modeling approaches
Sounding Strategies in AURA • Profile interactively guides satellite (OMI/TES) derivation of tropospheric ozone and assimilation • Simultaneously engage other EOS/A-train sensors (eg H2O, AIRS) • Full range of radicals, ozone precursors, deposited species (ground-based), plus aircraft/uav data constrain Models, Assimilation SONDE
Aura Concept:OMI/TES/Aircraft/Ground-based Strategy in Mid-Atlantic Region
IONS-2004: Pilot Study for Aura Integrated Strategy & MARVA • Beltsville IONS site proof-of-concept for MARVA; HU operated continuous surface ozone, CO, PM2.5 • Howard, UMCP students coordinated 20 sonde launches for IONS, UMCP aircraft rendezvous • UMCP ran MM5
Looking Ahead 2005-07:Aura-Models-Ground-based-Aircraft/UAV Synergism • 2005: Operate existing instruments in MARVA region • 2005: Develop, equip, test FAVOR ground • 2006-2007: Operate in mid-Atlantic; Deploy in INTEX-B, AVE, TC4