Download

1 / 25
250 likes | 461 Vues
A New Model for Stock Valuation. Zhiwu Chen Professor of Finance, Yale University Co-Chairman, ValuEngine Inc. The ValuEngine™ Stock-Valuation Model. Based on recent research by Bakshi & Chen (1997), Chang, Chen & Dong (1998) …

E N D
A New Model for Stock Valuation Zhiwu Chen Professor of Finance, Yale University Co-Chairman, ValuEngine Inc.
The ValuEngine™ Stock-Valuation Model • Based on recent research by Bakshi & Chen (1997), Chang, Chen & Dong (1998) … • Applying the methodology from bond valuation & options pricing (e.g., the Vasicek, the Cox-Ingersoll-Ross models, the Black-Scholes, …)
The ValuEngine™ Model • Fundamental Variables: current EPS, expected future EPS, and 30-yr bond yield • Firm-specific parameters: • EPS growth volatility • Long-run EPS growth rate • Duration of business-growth cycle • Systematic or beta risk of the firm • Correlation between the firm's EPS and the interest-rate environment • 30-yr Treasury yield’s parameters: • Its long-run level • Interest-rate volatility • Duration of interest-rate cycle
Mispricing Distribution Across Stocks Under- to overvaluation
Behavior of Book/Market Ratio over Time • This figure shows the average B/M ratio path for each quartile obtained by sorting all stocks according to their B/M ratios as of January 1990.
Behavior of E/P Ratio • This figure shows the average E/P ratio path for each quartile obtained by sorting all stocks according to their E/P ratios as of January 1990. • You would like to see the qartiles crossing each other over time. Yes, they do to some extent.
Behavior of ValuEngine Model Mispricing • This figure shows the average ValuEngine Model mispricing path, for each quartile obtained by sorting all stocks according to their mispricing levels as of January 1990. • The quartiles switch from over- to undervalued, and vice versa, every few years! Q1 Q4 Q1 Q4 Q4 Q4 Q1 Q1
ValuEngine™ Strategy One: focus on absolute valuation • Buy stocks that are undervalued by more than 10% and with a momentum rank higher than 70. • Sell a stock if it becomes at least 10% overvalued or has a momentum rank below 60.
ValuEngine™ Strategy Two: focus on relative-valuation • Buy Criteria: stock must have a mispricing rank and a momentum rank greater than 70 (on a 1-100 scale). • Sell Criteria: mispricing or momentum rank falls below 60.
Alpha & Beta: for Mispricing & Momentum portfolios • All the portfolios here are same as in preceding chart, based on Mispricing & Momentum.
Residual-Income Model Mispricing & Momentum Mispricing in this chart is determined by the residual-earnings model as implemented in Lee, Myers and Swaminathan (1998), where book value, EPS estimates, and CAPM-like expected returns are used as the basic inputs. Then, the mispricing quintiles are constructed and sorted accordingly.
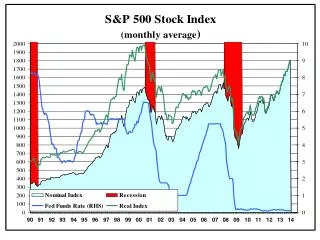
Using ValuEngine™to Forecast the Stock Market The “% of Undervalued Stocks” path indicates the then-current percentage of stocks that were undervalued at the time, relative to the entire stock universe. The other path is the then-1-yr-forward return on the S&P 500 index.
Conclusions • The best investment strategy: Combine ValuEngine valuation with momentum! • Hot and Cold stock groups switch every few years
ValuEngine Inc. • Specializing in putting theory to investment practice • Providing stock valuation and equity analytical tools • ValuEngine Inc. • Two Stamford Plaza, Suite 1550 • 281 Tresser Blvd. • Stamford, CT 06901 • (203) 335-0550