Download
1 / 30
300 likes | 446 Vues
Investing with a Stock Valuation Model. Zhiwu Chen, Yale University Ming Dong, Ph.D. candidate, OSU. Purpose. Models : The stock valuation model developed by Bakshi & Chen (1998) and extended by Dong (1998) The residual-income model implemented in Lee-Myers-Swaminathan (1997)

E N D
Investing with a Stock Valuation Model • Zhiwu Chen, Yale University • Ming Dong, Ph.D. candidate, OSU
Purpose • Models: • The stock valuation model developed by Bakshi & Chen (1998) and extended by Dong (1998) • The residual-income model implemented in Lee-Myers-Swaminathan (1997) • To compare their performance to traditional stock-selection measures: book/market, P/E, momentum, size, and so on
Motivation: why not expected-return models? • The CAPM, APT and other multi-factor models all focus on EXPECTED FUTURE RETURNs • Stock-Selection Idea: if the actual expected return on IBM is higher than its deserved expected return, then IBM is a buy (hence, Jensen’s Aplha) • But, what is IBM’s actual expected 1-yr-forward return today? ----- You cannot observe it! • Conclusion: you cannot really apply such expected-return models.
Motivation: why stock-valuation models? • There is always a market price for each stock ! • Stock-Selection Idea: if IBM’s market price is lower than its model price (fair value), then IBM is a buy (hence, undervalued stocks) • Conclusion: stock valuation modeling is the way to go. • But, is there a “good” equity-valuation model?
Motivation: existing stock valuation models • Variants of the Gordon model: too many unrealistic assumptions(e.g., a constant and flat term structure, constant dividend growth forever) • Multi-stage dividend/earnings/cashflow discount models: • No structural parameterization of the firm’s business • No attention paid to how the stock has historically been valued by market • Fair values determined by these models are too often below market price.
The Bakshi-Chen-Dong (BCD) Model • Fundamental Variables: current EPS, expected future EPS, and 30-yr bond yield • Firm-specific parameters: • EPS growth volatility • Long-run EPS growth rate • Duration of business-growth cycle • Systematic or beta risk of the firm • Correlation between the firm's EPS and the interest-rate environment • 30-yr Treasury yield’s parameters: • Its long-run level • Interest-rate volatility • Duration of interest-rate cycle
The BCD Model Detailed parameterization of EPS processes and interest-rate processParameters to be estimated from past data Closed-form stock valuation formula Past data are used to estimate parametersSo, valuation reflects both past valuation standard for the stock and the stochastic discounting of future prospects The Residual-Earnings Model (e.g., Lee, Meyer and Swaminathan (1998)) Two parameters: beta and dividend-payout ratio No closed-form valuation formula. Requires ad hoc approximation of the stock’s future price at end of forecasting horizon Valuation is independent of past valuation standard for the stock Comparison
Data • I/B/E/S, CRSP, and Compustat • Future EPS forecasts: consensus analyst estimates • Period covered: Jan. 1979 - Dec. 1996 • Stock universe: about 2500 U.S. stocks (mostly large cap)
What Constitutes a Good Stock-Selection Measure? • Mean-reverting, so that if too low, you can buy the stock, counting on the measure to go back to its norm. • Not too persistent, e.g., if book/market ratio is too persistent, you will not want to buy a stock just because it has a high B/M ratio. You would like fast mean-reversion • High predictive power of future stock performance
Behavior of Book/Market Ratio over Time • This figure shows the average B/M ratio path for each quartile obtained by sorting all stocks according to their B/M ratios as of January 1990.
Behavior of LMS Value/Price over Time • This figure shows the average Lee-Myers-Swaminathan V/P ratio path for each quartile obtained by sorting all stocks according to their V/P as of January 1990.
Behavior of E/P Ratio • This figure shows the average E/P ratio path for each quartile obtained by sorting all stocks according to their E/P ratios as of January 1990. • You would like to see the qartiles crossing each other over time. Yes, they do to some extent.
BCD Model Mispricing • Step 1: use past 2-yr data to estimate model parameters for the stock • Step 2: use current EPS, 1-yr-forward EPS forecast and 30-yr yield, plus the estimated parameters, to compute the stock’s current model price(out of sample) • Mispricing = [market price - model price] / model price • Thus, a negative mispricing means an undervalued stock, and so on.
Behavior of BCD Model Mispricing • This figure shows the average BCD Model mispricing path, for each quartile obtained by sorting all stocks according to their mispricing levels as of January 1990. • The quartiles switch from over- to undervalued, and vice versa, every few years!
A Small Summary • BCD Model mispricing is the least persistent over time and mean-reverting the fastest • It takes about 1.5 years for a group of stocks to go from most over- to most underpriced, or the reverse • P/E ratio is the second least persistent. • High P/E stocks do not always have the highest P/E. • B/M and V/P are the most persistent. • Stocks with the highest B/M seem to be always so. Low B/M stocks seem to always have low B/M.
Predictive Power for Future Returns • From the regression tables, • BCD Model Mispricing has the highest predictive power (for future 1-month, 6-month and 12-month returns) • Momentum comes second (defined on past 6-month or 12-month returns) • Size is the third most significant (the smaller the firm, the higher the future return) • Last comes B/M & V/P
Regressions of 1-month-forward Stock Returns on predictive variables
Do they perform differently across months: Month-of-the-Year Effect
Forming 2-dimensional Portfolios • Take mispricing - size quintile portfolios as an example • Step 1: for each month, sort all stocks into 5 quintiles according to their Mispricing levels. Independently, sort all stocks into 5 firm-size quintiles. • Step 3: intersections of the 5 Mispricing and 5 size quintiles result in 25 portfolios, for each month. • Step 3: average monthly return and volatility are then calculated for each Mispricing-size sorted portfolio. • All sorting and portfolio formations are out of sample.
Alpha & Beta:for Mispricing & Momentum portfolios • All the portfolios here are same as in preceding chart, based on Mispricing & Momentum.
LMS Mispricing & Momentum • Fair value in the V/P ratio is determined by the LMS residual-income model, where book value, EPS estimates and CAPM-based expected returns are used as the basis.
Investment by Mispricing & Sharpe Ratio Sharpe ratio is based on the stock’s past-5-yr average return divided by its volatility. It measures the risk-return tradeoff offered by the stock, hence representing “quality”. Not shown in this figure is that in each given Mispricing group, the higher the Sharpe ratio, the lower the portfolio’s volatility.
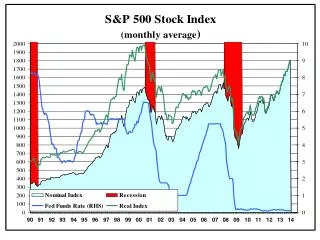
Forecasting the Stock Market The “% of Undervalued Stocks” path indicates the then-current percentage of stocks that were undervalued at the time, relative to the entire stock universe. The other path is the then-1-yr-forward return on the S&P 500 index.
Concluding Remarks • BCD Mispricing is strongly mean-reverting • overvalued => undervalued => overvalued => undervalued ….. • BCD Mispricing shows persistent winner-loser reversals (once every 1.5 years or so) • The winning strategy: • “ BCD Valuation + Momentum + Size ”