Spreadsheet Models
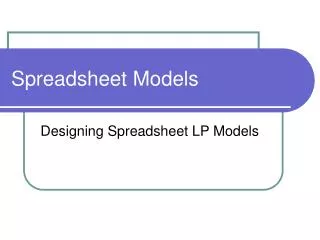
Spreadsheet Models . Designing Spreadsheet LP Models. Market research data scheduling information Engineering and design data Order flow and cash flow. Supplier. Customer. Ideas and design to satisfy end customer Material flow Credit flow. Inventory. Supplier. Customer. Manufacturer.

Spreadsheet Models
E N D
Presentation Transcript
Spreadsheet Models Designing Spreadsheet LP Models
Market research data scheduling information Engineering and design data Order flow and cash flow Supplier Customer Ideas and design to satisfy end customer Material flow Credit flow Inventory Supplier Customer Manufacturer Inventory Inventory Supplier Customer Distributor Inventory The Supply Chain
Supply Chain Management • Facilities, functions, activities for producing & delivering product or service from supplier to customer • Production planning • Selecting suppliers • Purchasing materials • Identifying facility locations • Managing inventories • Distributing product
Wall Street Journal, October 27, 2006: • Bill Ford Jr.:For Auto Makers, China is the New Frontier • On the outskirts of Nanjing, China, “Ford is finishing work on two sprawling new factories….Ford also has plants in Chongqing and Thailand.” • “Ford says it will shutter nine factories in North America by the end of 2008, and another seven factories by the end of 2012.”
Location Analysis Decision-making • Need to identify factors that are important for the location decision being made • Relevant factors will be influenced by • Type of facility • Geography involved
Factors in Ford’s Decision to Build Plants in China? • China is the world’s fastest-growing major vehicle market today • Transportation costs to this new market • China has a large, relatively cheap, skilled labor pool for manufacturing • Recent increase in number and quality of raw material and auto parts suppliers in China • Attractive manufacturing climate and supporting infrastructure
Location Analysis Technique Transportation Method Identify a location for a new facility so that the location minimizes the company’s overall cost of production and transportation for the supply chain. To perform this analysis, one must be able to model a given set of facilities and identify the shipping strategy that will minimize the total shipping costs.
Network Of Routes for KPiller 120 Amsterdam (500) Leipzig (400) 130 62 41 Nancy(900) 61 40 Antwerp (700) 100 110 Liege (200) 90 102.5 122 Le Havre (800) Tilburg (500) 42
The Transportation Tableau To Supply Leipzig Nancy Liege From Tilburg 120 130 41 62 500 Amsterdam 61 40 100 110 700 Antwerp 102.5 90 122 42 800 Le Havre Demand 400 900 200 500
Excel Model • Create a table for the unit shipping costs • Create a table for the shipping quantity from each source to each destination (sink) • Calculate the total shipped from each source • Calculate the total received at each destination • Calculate the total shipping cost for a shipping strategy • Create the spreadsheet model for the problem using the template outlined in Lpmodels.xls
Goals For Spreadsheet Design • COMMUNICATION - A spreadsheet's primary business purpose is that of communicating information to managers. • RELIABILITY - The output a spreadsheet generates should be correct and consistent. • AUDITABILITY - A manager should be able to retrace the steps followed to generate the different outputs from the model in order to understand the model and verify results. • MODIFIABILITY - A well-designed spreadsheet should be easy to change or enhance in order to meet dynamic user requirements.
Spreadsheet Design Guidelines • Organize the data, then build the model around the data. • Do not embed numeric constants in formulas! • Things which are logically related should be physically related. • Use formulas that can be copied. • Column/rows totals should be close to the columns/rows being totaled. • The English-reading eye scans left to right, top to bottom. • Use color, shading, borders and protection to distinguish changeable parameters from other model elements. • Use text boxes and cell notes to document various elements of the model.
Balanced Transportation Models • A transportation problem is balanced if Total supply at all of the sources = Total demand at all of the destinations • The KPilller transportation problem is currently balanced with Total Supply = Total Demand = 2000 engines • In this case, all of the units are shipped from the sources (harbors) and all of the destinations (plants) receive their demand
Unbalanced Transportation Models • If Total supply at all of the sources > Total demand at all of the destinations, the problem is feasible. There will be unshipped units at some of the source locations though. • (Resolve model with Nancy’s plant demand set equal to 700 engines) • If Total supply at all of the sources < Total demand at all of the destinations, the problem will be infeasible. • (Resolve model with Nancy’s plant demand set equal to 1000 engines)
Solving an Infeasible Unbalanced Transportation Model • The model needs to be balanced in order to identify an optimal shipping strategy. An extra source must be added into the model to supply the current shortage. • Extra capacity needed = Total demand at all destinations – Total supply at all current sources • To create this additional source of supply/capacity, either • Acquire a new facility/harbor and include it in the network design and spreadsheet model’s table structure or • add a Dummy source into the model’s table structure
Solving the KPiller Transportation Problem when Nancy wants 1000 engines • In this problem, the total demand exceeds the total supply by 2100 – 2000 = 100 engines • Insert a dummy harbor with a capacity of 100 engines and a unit shipping cost of $0 to each plant. Edit the spreadsheet model and Solver dialog box to include this new imaginary source. • The identified optimal solution will identify how many engines to ship from each harbor to each of the plants. The engines shipped from the dummy harbor are units that will not actually be distributed; these are the amounts that the receiving plants will be short in the eventual distribution.
Contracting a new harbor deal when Nancy’s demand is 1000 engines • In this problem, the total demand still exceeds the total supply by 2100 – 2000 = 100 engines • Insert a possible location for a harbor with a capacity of at least 100 engines along with the identified unit shipping costs from this location to each plant. Edit the spreadsheet model and Solver dialog box to include the new harbor warehouse at this location. • The identified optimal solution will identify how many engines to ship from each harbor, including the additional harbor at the new location, to each of the plants so as to minimize total costs
Questions to Reflect on…. • How would you use the transportation model to identify whether Hamburg or Gdansk might be a better location for an additional harbor? • What happens when you do not add a new “real location” to the network but use a dummy source which ends up shipping primarily to one destination? What can you do to resolve this problem?
Ragsdale Case 3.1 Revisited • “Putting the Link in the Supply Chain” • What type of models have we studied in this class to help you analyze this case? Sketch out the layout of the different models that you would need to integrate on a piece of paper. • How would you link the models together?
Scheduling Applications • Arlington Bank problem in packet • Template for scheduling model in lpmodels.xls • Discussion of Project 1: Chase Bank • Homework Practice: Chpt. 3 #25