Download
1 / 48
650 likes | 1.24k Vues
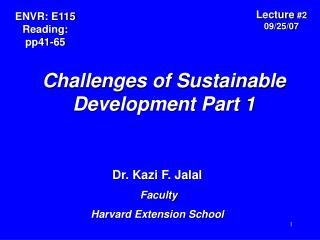
Lecture #2 09/25/07. ENVR: E115 Reading: pp41-65. Challenges of Sustainable Development Part 1. Dr. Kazi F. Jalal Faculty Harvard Extension School. Outline of Lecture 2. Definitions & Concepts P overty Reduction P opulation Planning P ollution Control P articipation

E N D
Lecture #2 09/25/07 ENVR: E115 Reading: pp41-65 Challenges of Sustainable Development Part 1 Dr. Kazi F. Jalal Faculty Harvard Extension School
Outline of Lecture 2 • Definitions & Concepts • Poverty Reduction • Population Planning • Pollution Control • Participation • Policy & Market Failures (prevention of) • Prevalence of good governance • Prevention of Disasters • Partnership
Sustainable Development Selected Definitions SD is a process that meets the needs of the present without compromising the ability of future generations to meet their own needs - World Commission of Environment & Development (1987)
Sustainable Development Selected Definitions Sustainable development argues for: (1) development subject to a set of constraints which set resource harvest rates at levels not higher than managed and natural regeneration rate, and (2) use of the environment as a “waste sink” on the basis that waste disposal rates should not exceed rates of managed or natural assimilative capacity of the ecosystem. - D. Pearce, Economics, Growth, and Sustainable Development, MacMillan, 1988.
Sustainable Development Selected Definitions If: x1 = m3 biomass removed/unit time x2 = m3 biomass regenerated/unit time Then: x1 < x2 ----------------------------------- If: y1 = ppm B.O.D./unit time y2 = ppm B.O.D. satisfied/unit time Then: y1 < y2
Sustainable Development Selected Definitions Sustainable development involves a process of deep and profound change in the political, social, economic, institutional, and technological order, including redefinition of relations between developing and more developed countries. - Maurice Strong, United Nations, 1992
Sustainable Development: Definitions & Principles, Conceptual Frameworks, Criteria & Indicators* *Please see: http://www.sustainableliving.org http://www.gdrc.org/susdev/ http://www.iisd.org/ic/info/ss9504.htm
ECONOMIC Project A Project C Project B SOCIAL ENVIRONMENTAL Project D Project A - Large-scale irrigation project with high B/C ratio; rich farmers benefit, causing health problems to local people who may not be direct beneficiaries; poor marginal farmers becoming landless laborers. Project B - Save the spotted deers or rhinos. Subsidized hospital project in a sparsely populated urban area Project C - Rural Water Supply project which benefits poor and women in particular, improves quantity and quality of available water, at low cost. Project D - Balancing Project Benefits Source: Smith et Jalal, 2000
Linkages Between Sustainable Development, Environment and Poverty SUSTAINABLE DEVELOPMENT POVERTY DEVELOPMENT Vicious Circle I Vicious Circle II Resource Depletion and Degradation Resource Depletion and Degradation Pollution of poverty Pollution of affluence ENVIRONMENT PROBLEMS POLLUTION, LAND DEGRADATION, CLIMATE CHANGE Poverty Alleviation Integration of Environment into Development * Meeting basic needs (health/education/shelter) * Productive employment * Control over common property resources * Population control * SEA & EIA of development projects * Technology for development * Rural-urban migration * Renewable energy issues * Regional and international cooperation Source: Jalal, 1993
Distribution of world income and economic Activity; percentage of world total (Quantiles of population ranked by income) World income - 1.4 World trade - 1.0 Commercial lending - 0.2 Domestic Savings- 1.0 Domestic investment-1.3 Global Income Distribution & Disparities World Income - 82.7 World Trade - 81.2 First 20% Commercial Lending: 94.6 Domestic Savings - 80.6 Domestic Investment - 80.5 82.7 % Second 20% 11.7 % Third 20% World Income 2.3 % Fourth 20% 1.9 % Poorest 20% 1.4 % Source: UNDP, 1992:worldrevolution.org
Income Disparity Between the Richest and Poorest 20% of the World’s Population 150:1 59:1 Ratio of Income Shares Richest 20% 45:1 Poorest 20% 32:1 30:1 1960 1970 1980 1989 2006 Source:1) UNDP 1992,1999; 2)ICC study on globalization 2003 3)Anup Shah: Poverty facts 2004; 4)Development & Poverty(2006): worldrevolution.org
Region Where the Poorest People of the World Live Source: J.Sachs(2005):the End of Poverty ; Merryll Lynch (2007):
Poverty & Global Priorities in Spending • Items of expenditure US$b/yr • Cosmetics 18 • Perfumes 15 • Ice cream in Europe 11 • Pet foods in USA & Europe 17 • Business entertainment, Japan 35 • Cigarettes in Europe 50 • Alcoholic drinks in Europe 105 • Narcotic drugs in the World 400 • Military spending, Global 780
Poverty & Global Priorities in Spending • Basic needs US$b/yr • Basic education for all 6 • Water & sanitation for all 9 • Basic health & nutrition for all 13 • Reproductive health for all 12 (women in the world) __________________________________ *Anup Shah(2004): Poverty facts; State of the world(2004); Globalissues.org/traderelated/facts
World Population Trend and North-South Distribution World Population Trend and North-South Distribution 9.3 8 North 6 South 4 1950 1980 2025 2 2050 1820 1920 2020 1996 Billions of People Source: UNDP, 1990; US Census Bureau,2004:World Population 1950-2050
Projected Growth in World Population* *UNpop.Div.(2004);WRI(2006) earthtrends.wri.org 9.3 b
Projected Growth in World Economy, Population, and Chemical Production, 1995-2020* Source:OCED (2001) Environmental Outlook for the Chemical Industries 185 175 130
Industrial Materials Groups* Source: Kenneth Geiser “Materials Matter: (2001 MIT Press)
Global Atmospheric Emissions of Lead and Mercury by Major Industrial Source, Mid-1990s, with Decline since 1983*
Global Regional Air Pollution : Particulates Source: ADB & HIID, 1995
Global Regional Water Pollution : Organic Pollution Source: ADB & HIID, 1995
Global Regional Forests Source: ADB & HIID, 1995
Participation Definition Participation is a process through which stakeholders can influence and share control over development initiatives and over decisions that affect their lives in one way or another.
Children on Earth Day Celebration Women in Development Poor Population Local Government in the Field Minority Group NGOs at Work
Mechanisms to FacilitateParticipation • Mechanisms forSharing Information • Mechanisms for Consultation • Mechanisms forCollaborative Decision-Making • Mechanisms toFacilitate Empowerment Source: ADB 1996
Policy and Market Failures • Policy failure includes both failure to intervene when necessary and beneficial, and failure to refrain when intervention is unnecessary or detrimental • Market failures occur when freely functioning markets produce prices that do not reflect true social costs or benefits of an action
Examples of Policy and Market Failures • Attaching a zero price for air and water, a low price on raw materials, and a high price for finished products. • The coexistence of overuse, waste and inefficiency with growing resource scarcity • Exploitation of resources which could otherwise be managed as a renewable resource. • Not recycling resources and byproducts even though it could generate economic and environmental benefits • Depriving local communities of their customary rights of access even though they may be the most effective resource managers. Source: ADB, 1994
More examples of policy & market failures • Putting an increasingly scarce resource into inferior, low-return and unsustainable uses, when superior, high-return, sustainable use exist • Putting a resource into single use when its multiple use would generate a larger net benefit • Neglecting to invest in the protection of resource base even though such action would generate greater net benefit in the long run
Good Governance Definition The manner in which power is exercised in the management of a country’s economic and social resources for development -Webster’s Dictionary, 1979
Four elements of good governance are: • Accountability • Participation and decentralization • Predictability • Transparency
Corruption in 2006** Google: CPI 2006 • -Corruption Perception Index (CPI) • - 163 countries surveyed • -Most clean (Finland, Iceland & New Zealand) Score: 9.6 • Most corrupt (Haiti) 1.8; second (Myanmar Iraq& Guinea) 1.9 third( Bangladesh, Chad, Congo & Sudan) 2.0 • USA 20th position down from 17th a year ago(7.3)
Disasters are widely defined as: “The abnormal or infrequent hazards to communities or geographical areas that are vulnerable to such events, causing substantial damage, disruption and often casualties, leaving the affected community unable to function normally.” Derived from : UN Disaster Relief Office, OECD, and others. Source: Hammond, 1998
Terrorism “When a state or a group of non-state actors direct violence against the civilian population of its own or of another state, it is called terrorism”- Mark Selden & Alvin Y. So (2004) : War & State Terrorism. Rowman & Littlefield Publidshers
8.Partnership • -Governments • -WB,RDBs and international orgs. • - Private sector • -NGO and Civil Society
191 Countries (out of 195) • 109 Heads of State/Government • 18000 Official Delegates • 50000? Total Delegates PUBLISHED BY THE UNITED NATIONS DEPARTMENT OF ECONOMIC AND SOCIAL AFFAIRS AUGUST 2002 www.johannesburgsummit.org
WSSD OUTCOME • UN Officials • Modestly Successful • NGO Activists • Glamour event without substance • There is not single shining outcome • Teetering between qualified success and outright failure • Lack of meaningful targets and commitments • One Head of State • Dialogue of the deaf
World Summit Negotiation, 2002 • AFRICAN didn’t know what “FOOD” meant • W.EUROPEAN ……. “SHORTAGE”… • E.EUROPEAN …….. “OPINION” … • MIDDLE EASTERN …… “SOLUTION” …. • SOUTH AMERICAN ……. “PLEASE” ….. • ASIAN ….. “GOVERNMENT” … • AMERICAN ….. “REST OF THE WORLD” .. • UNITED NATIONS ….. “BRIEF” …..
To Make Development Sustainable: • Reduce Poverty • Plan Population • Control Pollution • Strengthen Participation • Rectify Policy and Market Failure • Establish Good Governance • Manage Disasters • Promote Partnership