Lapse Rates and Flow Over a Mountain
70 likes | 253 Vues
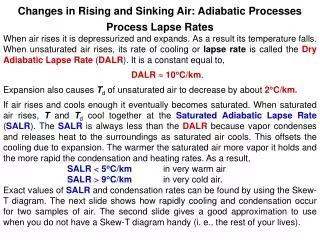
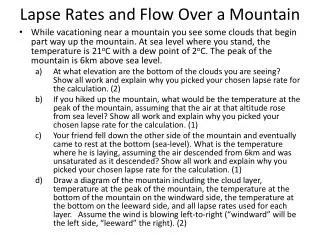
Lapse Rates and Flow Over a Mountain. While vacationing near a mountain you see some clouds that begin part way up the mountain. At sea level where you stand, the temperature is 21 o C with a dew point of 2 o C. The peak of the mountain is 6km above sea level.

Lapse Rates and Flow Over a Mountain
E N D
Presentation Transcript
Lapse Rates and Flow Over a Mountain • While vacationing near a mountain yousee some clouds that begin part way up the mountain. At sea level where youstand, the temperature is 21oC with a dew point of 2oC. The peak of the mountain is 6km above sea level. • At what elevation are the bottom of the clouds youare seeing? Show all work and explain why you picked your chosen lapse rate for the calculation. (2) • If youhiked up the mountain, what would be the temperature at the peak of the mountain, assuming that the air at that altitude rose from sea level? Show all work and explain why you picked your chosen lapse rate for the calculation. (1) • Your friend fell down the other side of the mountainandeventually came to rest at the bottom (sea-level). What is the temperature where he is laying, assuming the air descended from 6km and was unsaturated as it descended? Show all work and explain why you picked your chosen lapse rate for the calculation. (1) • Draw a diagram of the mountain including the cloud layer, temperature at the peak of the mountain, the temperature at the bottom of the mountain on the windward side, the temperature at the bottom on the leeward side, and all lapse rates used for each layer. Assume the wind is blowing left-to-right (“windward” will be the left side, “leeward” the right). (2)
Stability • For a class field trip, we traveled to the middle of tornado alley and launched a weather balloon. At 1km above us, the temperature was 18oC and 3km above us, the temperature was 4oC. The air at 1km is saturated, while at 3km it is very dry. • Calculate the lapse rate of the 1-3km layer. What is the stability of this layer? (2) • Assume the air at 1km risesto 3km and the air at 3km risesto 5 km. What are the temperatures at the bottom and top of the 3-5km layer? (1) • Calculate the lapse rate of this 3-5km layer. What is the stability of this layer? (2)
1020 1016 25 1012 30 1008 35 40 L 45 50 25 30 35 Isotherm (a few selected) 40 45 Isobar (a few selected) 50
Questions for Cyclone Map • Draw arrows indicating the wind direction around the low-pressure at the black circles. Assume moderate friction. (4) • Place a bold X in a region that is experiencing cold air advection and a bold Y in a region that is experiencing warm air advection. Why did you choose these areas? (2) • Label each front as “Warm” or “Cold.” How did you decide which is which? (2) • If the system were to follow the black arrow, shade a region where we would expect a swath of snowfall (given that it is winter in the NH). (2)
500mb Heights 5510 5460 5350 5255 5280 5409 5315 5550 5505 5450 5285 5330 5460 5351 5590 5555 5490 5330 5400 5475 5395 5632 5599 5520 5465 5530 5469 5423 5577 5611 5609 5579 5635 5529 5533 5908 5901 5660 5640 5656 5735 5640
Questions for 500 mb Map • Draw height contours in 60 meter intervals. Remember to label each contour and start at 5400m. (5) • Mark the axis of a trough with a heavy, dashed line. (1) • On which side of the trough is upper-level convergence likely? (1) • On which side of the trough is upper-level divergence likely? (1) • Draw a large “H” on the map where anticyclo-genesis is likelyto occur at the surface. (1) • Draw a large “L” on the map where cyclogenesis is likely to occur at the surface. (1)
Eyewall from Hell In this not-drawn-to-scale scenario, a hurricane eye wall (large circle) contains two weak tornados in it (medium circles). Each of these tornados contains two suction vortices (smallest circles). The wind speed is 100 mph around the hurricane, 80 mph around each tornado, and 120 mph around each suction vortex. Also, the entire system is moving north at 20 mph. A B C D E F G H I At each point, calculate the wind speed relative to the ground. (½ ea) At each point, calculate the wind speed relative to the hurricane. (½ ea)