Download
1 / 55
550 likes | 759 Vues
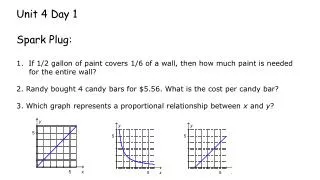
Unit 4 Day 1 Spark Plug: 1. If 1/2 gallon of paint covers 1/6 of a wall, then how much paint is needed for the entire wall? 2. Randy bought 4 candy bars for $5.56. What is the cost per candy bar? 3. Which graph represents a proportional relationship between x and y ?.

E N D
Unit 4 Day 1Spark Plug:1. If 1/2 gallon of paint covers 1/6 of a wall, then how much paint is needed for the entire wall? 2. Randy bought 4 candy bars for $5.56. What is the cost per candy bar? 3. Which graph represents a proportional relationship between x and y?
How do you predict the winner of an election before the election takes place?
In this lesson you will learn how to collect data about a population by identifying a sample of the population.
Statistical questions are used to gather data about a population. How many texts do middle school students send in one day?
By surveying a sample of the group, you can make a generalization about the entire group.
The population is the entire group being studied. A sample is part of the population being surveyed.
For example: Predict the winner of the upcoming presidential election American voters Population Sample Adults walking to work
Another example: Tracking migration pattern of birds A bird species Population Tagged birds Sample
In this lesson you have learned how to collect data about a population by identifying a sample of the population.
Identify the population and sample in the following survey: To gauge students’ preference for a new school mascot, the Student Council President surveys her soccer team. Population Sample
Answer the following questions. • You are buying ice cream for a party at your school, in which 700 students will attend. How would you use sampling to make a generalization about students’ preferred ice cream flavors? • Why not survey all 700 students? • Describe the sample you would survey, and explain why you chose that sample.
Identify the population and the sample: 1. A telephone survey is given to 2,000 randomly selected families in order to predict the average amount of money American families spend on groceries each week. 2. To determine the number of students who carry backpacks in school, Tina collects data on the first 100 students who enter the building.
Statistical measures are then used to analyze that data. How many texts do middle school students send in one day? Mean Median Mode Range Interquartile Range Mean Absolute Deviation
If you had to order t-shirts for your entire school, what sample would you choose to help you predict how many t-shirts of each size to order?
In this lesson you will learn how to identify representative samplesby differentiating between biased and unbiased methods of sampling.
The population is the entire group being studied. A sample is part of the population being surveyed.
How tall are 7th graders? Not all samples will lead to good predictions about an entire population.
? Representative sample accurate prediction based on data Valid inference
Sampling method Unbiased Biased
This sample comes from a biased sampling method. It is not representative of the population.
This sample comes from an unbiased sampling method. It is representative of the population.
Another example: Color of leaves in September • 100 fallen leaves collected from the ground • 100 leaves on tree branches c) 50 fallen leaves and 50 leaves on branches d) 50 fallen oak leaves and 50 oak leaves on branches
Unbiased sampling method Representative sample Valid inference
In this lesson you have learned how to identify representative samplesby differentiating between biased and unbiased methods of sampling.
A market researcher wants to know how 18-25 year old women spend their money. Which group would be a representative sample? a) 18-25 year old women at the mall b) 18-25 men and women commuting to work c) Women of all ages commuting to work d) 18-25 year old women commuting to work
In a complete paragraph, describe why the following sampling method is biased, and suggest an unbiased method. You want to know your town’s favorite fast-food restaurant. You randomly ask 30 people their preference as they leave one of the fast-food restaurants in town.
1. An ice-cream company wants to find out if its ice cream is the favorite in the state. Which group would be a representative sample? • Customers who visit their store • Employees of ice cream stores in the state • People at the state fair • Adults entering a gym in the capital city
2. Which is an unbiased sampling method for predicting the type of payment most frequently used at a grocery store? Record the type of payment used by… • Students at the local high school • Every 10th customer entering the store c) Every 10th customer in the cash-only line d) Visa card holders
Random Sampling • The “pick a name out of the hat” technique • Random number table • Random number generator
Systematic Sampling • All data is sequentially numbered • Every nth piece of data is chosen
Stratified Sampling • Data is divided into subgroups (strata) • Strata are based specific characteristic • Age • Education level • Etc. • Use random sampling within each strata
Convience Sampling • Data is chosen based on convenience • BE WARY OF BIAS!
Voluntary Response Sampling • A sample which includes only willing participants
Unit 4 Day 2 and 3Spark Plug:1. Identify the constant of proportionality in the following graph. 2. What is the percent decrease on a TV that is marked down from $400 to $350? 3. Identify the constant of proportionality in the following table.
Learning Task: Is It Valid? STANDARD ADDRESSED IN THIS TASK MCC7.SP.1. Understand that statistics can be used to gain information about a population by examining a sample of the population; generalizations about a population from a sample are valid only if the sample is representative of that population. Understand that random sampling tends to produce representative samples and support valid inferences
Complete each survey: (you have 8 min) • There are 5 surveys around the room. • Quickly take each survey by placing your sticker on the appropriate answer. • When finished, sit quietly and wait for instructions.
What color is your hair? Brown ______ Blond ______ Red ______ Black _______ • Do you carry a cell phone? Yes______ No _________ • About how many text messages do you send in a day? 0-20 _____ 21-40 ______ >40 ______ • About how much time do you spend on homework? 0-15 min _____ 16-30 min _____ 31-45 min ______ 46-60 min _______ > 60 min ______ • What month were you born? Jan – March _____ April – June _____ July-Sept. _____Oct-Dec ______
Using the survey results discuss the following vocabulary. What is the population of your survey? The population is the entire class. Population is the entire set of items for which data can be collected. Did your class perform a census or a survey?A census means you ask everyone in the population. Survey means you ask a representative sample of the population. This is a census. How would you describe your results from question 2 as a parameter for the population? A parameter means you describe a characteristic about the population based on your data. Most seventh grade students carry a cell phone.
The manager of the Millcreek Mall wants to know the mean age of the people who shopat the mall and the stores in which they typically shop. He hires Barker Market ResearchCompany to collect the data. Dennis works for the Barker Market Research Company andhas been put in charge of collecting data for the Millcreek Mall. Dennis decides to interview 100 people one Saturday because it is the mall’s busiest shopping day. • Is the survey a sample or a census? • It is a sample. • What is the population for this survey? • The population is everyone who comes to the mall. • Is the sample size for the survey appropriate? • The sample size is too small for the population. The 100 people are not a representative sample of the entire population.
In the summaries that follow, determine if the sample taken is representative of the population without bias shown:
ABC Family is a television channel that targets families and young adults to view their station. ABC Family regularly posts online poll questions to their website. In 2010, ABC Family polled their viewers to ask about airing Rated “R” movies after 8pm on their channel. Almost 200,000 people responded, and 85% of them disagreed with airing Rated “R” movies. Solution: Voluntary Response- ABC Family is only asking from data from their viewers, which may tend to be more conservative since it is a family targeted television station.
Mrs. Jones wants to know how the 5th grade feels about recess time. Mrs. Jones labels every student in the 5th grade with a number. She then draws 50 numbers out of a hat and surveys these students. Mrs. Jones determines that 5th graders would like more recess time than they currently have. Solution: This is a Simple Random Sample (SRS). Mrs. Jones gave each child in the 5th grade the same chance of being selected.
The City of Smallville wants to know how its citizens feel about a new industrial park in town. Surveyors stand in the Smallville Mall from 8am-11am on a Tuesday morning and ask people their opinion. 80% of the surveyed people said they disagreed with a new industrial park. Solution: This is convenience sampling. People at a mall are “easy to reach”, but not every individual in Smallville has an equal chance of being chosen. For example, people that work and are not at the mall on Tuesday morning have no chance of being chosen.
The National Rifle Association (NRA) took a poll on their website, www.nra.com, and asked the question, “Do you agree with the 2nd Amendment: the Right to Bear Arms”? 98% of the people surveyed said “Yes”, and 2% said “No”. Solution: This is voluntary response. The NRA only asked people on their website, which are more likely to be “pro 2nd amendment.”
Unit 4 Day 4 Spark Plug:1. Which data set represents a proportional relationship between x and y? Use tables above. 2. Based on the information given in the table shown below, which of the following equations correctly states the relationship between x and y? • y = 4x • y = x ÷ 4 • y = x + 4 • y = x – 4