Download
1 / 25
250 likes | 267 Vues
Discover the key trends in renewable energy for 2018, including capacity growth, investment shifts, and sector advancements globally. Gain insights into renewable energy's expanding role in the energy landscape.

E N D
CEEW Energy Horizons 18 July 2019, Abu Dhabi Rana Adib REN21 Secretariat gsr@ren21.net
REN21 – A policy network to build a sustainable energy future with renewables Whowe are… Whatwe do… Thematic Reports Global Status Report: yearly publication since 2005 Renewables in Cities Status Report: Regional Reports Global Futures Reports 23-25 October, 2019
Renewables Global Status Report Collaborative annual reporting since 2005 building on international expert community. The report features: 01. Global Overview 02. Policy Landscape 03. Market & Industry Trends 04. Distributed Renewables for Energy Access 05. Investment Flows 06. Energy SystemsIntegration and Enabling Technologies 07. Energy Efficiency 08. Feature: Renewable Energy in Cities
Another strong year for renewable energy • Total global capacity rose 8% in 2018 • Non-hydro capacity grew 15% • 1,246 GW by the end of 2018 • 181 GW of renewable power added • Leaders: Solar PV = 100 GW (55% of new additions) Wind power = 51 GW (28%)
Investment in renewable energy fell in China, rose elsewhere • Global investment in renewable power and fuels totalledUSD 288.9 billion, a decrease of 11.5% • Fifth consecutive year in which investment topped USD 280 billion • India: USD 15.4 billion, 4thglobally, a decrease of 16%
Power sector leading: Renewables supply more than 26% of global electricity • Renewables supplied an estimated 26.2% of global electricity at the end of 2018 • For the first time, more electricity was from solar PV than bio-power
Renewable power now makes up over one-third of global capacity • Renewable energy is now more than 33% of global installed power generating capacity • Within renewable capacity, hydropower (1,132 GW) no longer makes up half of installed capacity • Wind power (592 GW): accounts for 25% and solar PV (505 GW) covers over 21%
Solar PV capacity additions pass 100 GW mark in 2018 • Solar PV capacity additions were more than 100 GW for the first time • Cumulative capacity reached 505 GW, an increase of 25% from 2017 • India: 33 GW, 5th in the global rankings
Wind power capacity continues to increase steadily year-on-year • The additions in 2018 pushed cumulative capacity up 9% to 591 GW • Of the 51 GW added, nearly 47 GW was onshore and 4.5 GW was offshore • India: 35.1 GW total installed wind capacity, decrease in 2018 of 50%
Variable renewable shares have grown dramatically in some countries • The power sector is transforming rapidly in some countries • Variable renewables have seen penetration rates above 20% in at least nine countries in 2018 • Average annual growth rates of more than 10% in at least five countries
Beyond power: over 80% of demand for heating, cooling, and transport • Over half of final energy demand is from the heating and cooling sector • < 10% of this demand is supplied by renewable energy • 32% of final energy demand is for transport end-uses • Just over 3% is renewable and primarily met by biofuels • Around 26% of electricity was renewable in 2016
Heating and Cooling – Distributed solutions and local markets
Biofuels and EVs growing but renewable share in transport remains low • Global energy demand in transport increased 45% since 2000 • Transport accounts for 23% of global CO2 emissions • The renewable share of transport grew slightly to 3.3% • Biofuels make up majority of renewable contribution, but sector increasingly open to electrification
Biofuels production increases, dominated by US and Brazil • Biofuels production increased nearly 7% in 2018 • US and Brazil together produced 69% of all biofuels • India: 6th largest ethanol producer (+70% in 2018) • Biomethane and advanced biofuels represent still small shares, though biomethane is growing rapidly in some countries
Electric passenger vehicle stock grew over 60% • 260 million electric two-wheelers and 40 million electric three-wheelers • More than 2 million electric cars(inc. battery EV and plug-in hybrid EV) were sold in 2018 (+68%) • EV markets highly concentrated: 50% in China, 22% in the US; 40% of all EVs in just 20 cities • Share of RE power: around 25%
Advances in power made possible by policy support, other sectors lag • Renewable power auctions were held in at least 48countries • FITs in place in 111 countries • No new countries adopted biofuels mandates • The number of countries with H&C regulatory policies fell by 1
Targets uneven across sectors • Power sector: targetsremain more ambitious, more numerous than in heating and cooling and transport • Fewer than 10 countries and states/provinces had economy-wide targets for at least 50% renewable energy • Still only 1 country with a target for 100% renewables in total final energy
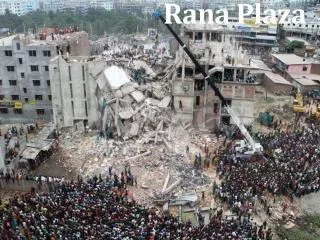
Not a level playing field: fossil fuel subsidies are still widespread • Global subsidies for fossil fuel consumption reached an estimated USD 300 billion in 2017 • an 11% increase from the year before • about double the estimated support for renewable power generation • Fossil fuel subsidies remained in place in at least 115 countries in 2017 • 73 countries provide subsidies of more than USD 100 million each
Access to energyexpanding • In 2017: • 13% of the global population livedwithoutelectricity– approx. 992 million people • 36% of the global population livedwithout clean cooking – approx. 2.7 billion people • A majority live in rural areas of sub-SaharanAfrica and Asia-Pacific regions
Off-grid solar PV is increasingly widespread • 150 million peopleacross Africa and Asia benefit from energy access through off-grid solar systems • 5% of the population in Africa • 2% of the population in Asia
Production of biogas for cooking expands in new markets • 125 million people using biogas for cooking • China = 111 million • India = 9 million • China: 13.1 billion m3 of biogasproduced for cooking; • India: 1.7 million m3 • Use of biogas for cooking grew over the past five years • Asia: Bangladesh, Cambodia, Indonesia, Nepal • sub-SaharanAfrica: Burkina Faso, Ethiopia, Kenya, Tanzania,Uganda
The transition is possible – positive examples are showing the way! • Leadership from national governments is paving the way towards 100% renewables in countries. • Cities and sub-national governments are setting more ambitious policies than their national governments. • 1000+ organisations, totaling USD 8 trillion of managed assets, have committed to divesting from fossil fuels. • The private sector has doubled its investment in sourcing renewable power.
Renewable Energy Policy Network for the 21st Century Thematic Reports Global Status Report: yearly publication since 2005 Renewables in Cities Status Report: Regional Reports Global Futures Reports REN21 Academy International Renewable Energy Conferences SAVE THE DATE: 22-25 October 2019 Seoul, Republic of Korea www.ren21.net/gsr Subscribe to our newsletter www.ren21.net