Download
1 / 32
350 likes | 650 Vues
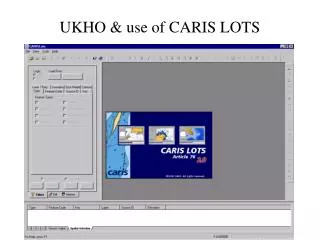
UKHO & use of CARIS LOTS. Development of CARIS LOTS. 1998 - LOTS project announced for a tool to define the continental shelf Sept 98 - Met CARIS team during ABLOS conference April 99 - First visit to CARIS project

E N D
Development of CARIS LOTS • 1998 - LOTS project announced for a tool to define the continental shelf • Sept 98 - Met CARIS team during ABLOS conference • April 99 - First visit to CARIS project • Sept 99 - Purchased Licence, attended training and took v0 of software for testing • Jan 00 - v1 issued • May 00 - v2 issued
CARIS LOTS v0 • CARIS took an early input from LOS to broaden use of tool for all LOS activities • Testing proved the concept to be very sound • Many more improvements input by LOS to broaden use of application. • Some annoying bugs but already LOS was producing quick, accurate data
CARIS LOTS v1 • First release for general sale • Hurried out to meet marketing deadline • Some bugs remained but a sound product • Used for full scale marketing campaign and demonstrations to good effect • Many useful lessons on functionality learned
LOTS v2 • The current edition and fully functional • Improved methods for handling seismic data. • 2 min. grid predicted bathymetry included in database • World Vector Shoreline included in database.
Further developments from UKHO view • General modifications in hand to improve user friendliness • Facility to plot range and bearing from a point • Enhanced toolkit for automated derivation of FOS • CARIS accept LOS argument for inclusion of ARCS - to be available in v3 • Improvement to graphics package for publishing useful illustrations • Improved import / export facilities for data and maps • Development of database links to develop world model of boundaries, limits and median lines required for ENC • Development of proportional calculation for median lines
A similar process imports a raster image of sediment thickness
Other sources of coastline • Import a chart image • Digitise coastline manually within CARIS • Slow and tedious task • Digital model of coastline should be easier to generate.
Import line data • Established boundaries or digitised line detail • CARIS import wizard • Format suitable ASCII text file • Define datum and set up WGS transformation parameters • Read in x-y file
Working on Coastline model By isolating coastline sections
A median line is produced in 7 minutes • 7000 points on each coast examined • 174 points calculated on the median line • Each point a rigorous geodetic calculation • Would take a week to do by hand
Maritime Limits are just as easy • Isolate the coast • Automatically generate a limit from Anglesea to IOW in 5 minutes • By hand that requires use of 50 charts working at 4 or 5 a day
Generating Limits • Complex vector model of the coastline • Each turning point buffered individually • Generates an envelope of arcs • Uses spheroidal distances • Buffering a simple Loxodrome • Digitise end points • Fill line with additional points at any interval • Buffer line as a coastline model • Buffering a Geodesic Line • Digitise end points • LOTS calculates geodetic azimuth and in-fills with points at 1M intervals then buffers line as coastline.
Juridical Bays • Automatic testing • Pick coastline • Mark entrance points • Length of closing line and area enclosed checked against UNCLOS • Line can be adjusted to maximise allowed closure • Finished closing line added to baseline model
New data can be imported • 2.7 million soundings from NW edge of continental shelf • Read into CARIS, contoured at 100m and rasterised for analysis in about 40 minutes
Profile shows: • Bottom profile across the foot of the continental slope • 2nd derivative of gradient for choosing the allowed foot of slope • A marker placed here and copied onto the main chart, maps the foot of the slope line
Successive depth profiles • Generate points on the foot of slope • Join points into a line • Buffer the line 60M to seaward • Generates one of the CS outer claim lines
Similar interrogation of sediment x • Shows sediment thickness against distance from foot of slope • Calculates points where the 1% rule applies • Places marks on the Chart [choosing seaward point] • Joins marks to produce the 1% sediment claim line
Single line seismic data • Single lines of sediment thickness can be imported • Whole line can be tested against successive FOS markers • Produces all points on line which meet 1% criteria to map Gardiner Line
To complete a Continental Shelf claim • Buffer coastline model to 350 miles for 1st cut off • Buffer 2500m contour 100M seaward for 2nd cut off • Select 2 claim lines and 2 cut off lines • CARIS automatically combines claim lines & cut off lines to derive maximum allowed claim • User picks optimum points for outer claim up to 60M apart • All saved profiles and line data is available to document claim
Consultancy Opportunities • A desk-top study can be built on the CARIS data sets to achieve an approximate CS claim line in 2 days • Accurate bathymetry and sediment data can be imported at any time to refine model • CARIS model can be used to plan data gathering and monitor progress • Raster chart images can be imported to generate accurate baseline model for limits and boundary calculations • Coastline on non raster charts can be digitised and imported as an ASCII text file • Any line or point can be constructed • Area and distance calculations are automated
ENC • Digital Charts and additional layers on Raster Charts require definition of areas with common values • CARIS will generate all maritime regime data needed for these layers • At present, like many, UKHO only maintains limits and boundaries on a very small number of charts. • Maritime regime data will be required for all published ENC and will require significant work to develop and maintain databases defining regimes. • CARIS already provides applications to produce ENC, LOTS will work directly to this package. • CARIS should consider building a database to manage LOS layers
Biased Median Line Calculations • GIS allows consideration of re-iterative method to generate biased “median line” solutions. • Equi-ratio method will use pairs of buffered lines with fixed ratio to buffer distances. • Re-iterative buffer to cover whole area • Map buffer intersection points and derive weighted line • Equi-area method more awkward • Define relevant coastal lengths • Buffer 1 coast by a fixed amount and the other by a calculated amount to enclose the same area • Map intersection points
Summary • UKHO is very satisfied that CARIS will produce an accurate solution to any problem faced by LOS. • LOTS has enabled new work to be undertaken and very significant savings in time. • In conjunction with a good illustration package, LOTS will generate a quick, accurate and professional illustration of any aspect of LOS work • CARIS remain keen to continue development of LOTS to improve usability and the scope of problems it can address • Weak areas are • Generation of baseline model from RASTER / Paper images • Import and export of data • Lack of ability to build integrated database