Download
1 / 33
340 likes | 433 Vues
Study assessing flood hazard and landscape changes' impact in Yantra river basin, utilizing modeling tools SWOT, SWAT, KINEROS. Evaluated factors include runoff, vegetation, and water quality.

E N D
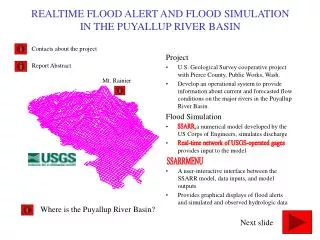
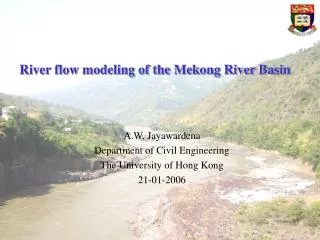
MODELING FLOOD HAZARD IN YANTRA RIVER BASIN Stoyan Nedkov Mariyana Nikolova Institute of Geography Bulgarian Academy of Sciences
FLOODS 2005 22 people dead 440mln euro damages 14000 people evacuated 16000 damaged houses
RECHARGE INFLOW = OUTFLOW INFLOW AND OUTFLOW AT CONSTANT RATES RECHARGE ET ET S Water Table D N A M L A T INFLOW FROM SURFACE WATER E E R W T S BEDROCK OUTFLOW AS BASE FLOW TO STREAM AND TO VEGETATION AQUIFER BEDROCK HYDROLOGIC CYCLE (Semmens et al., 2005)
Conceptual Model of Hydrologic Response Natural Condition Land cover change Degradation Urbanization Woody plant invasion Decreased Vegetation infiltration interception evapotranspiration surface roughness Increased Runoff Increased Velocity soil moisture flood hazard groundwater recharge Increased Erosion Decreased Water Quality (Semmens et al., 2005)
MAIN OBJECTIVES OF THE INVESTIGATION • Assessment of the floods hazard • in the Yantra river basin • Evaluation of the influence of landscape • changes on the hazard
STRUCTURE OF THE PRESENTATION • Study area • Materials and methods • Results • Conclusions
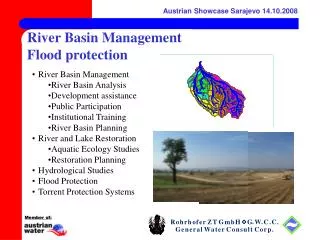
STUDY AREA YANTRA BASIN SOFIA
2005 floods in Yantra Basin Flood water level
Floods in Yantra basin Source: GA “Civil Defense”
STRUCTURE OF THE PRESENTATION • Study area • Materials and methods • Results • Conclusions
Materials and methods • Floods hazard assessment • Frequency of occurrence • Class interval • Total loading • Floods hazard modeling • AGWA tool • SWAT model • KINEROS model
Floods hazard modeling Land Cover change analyses Scenarios development Modeling runoff Floods hazard assessment According to different scenarios
KINEROS Outputs SWAT Outputs Channel Infiltration (m3/km) Precipitation (mm) Plane Infiltration (mm) ET (mm) Runoff (mm or m3) Percolation (mm) Sediment yield (kg) Surface runoff (mm) Peak flow (m3/s or mm/hr) Transmission loss (mm) Channel Scour (mm) Water yield (mm) Sediment discharge (kg/s) Sediment yield (t/ha) AGWA Inputs and Outputs Watershed Discretization (model elements) Intersect model elements with + Digital Elevation Model (DEM) Soil Land Cover Rain Run model and import results Results (Semmens et al., 2005)
Soil Water and Assessment Tool (SWAT) It is designed to predicts the impact of land management practices on water, sediment and agricultural chemical yields in large complex watersheds with varying soils, land use and management conditions over long periods of time (Arnold et al. 1994) • Daily time step • Distributed: empirical and physically-based model • Hydrology, sediment, nutrient, and pesticide yields • Larger watersheds (> 100 km2) Abstract Routing Representation 73 71 to next channel 71 73 channel 73 73 pseudo- channel 71
71 73 72 74 Kinematic Runoff and Erosion Model (KINEROS2) KINEROS is a distributed, physically based, event model, describing the processes of interception, dynamic infiltration, surface runoff and erosion from watersheds characterized by predominantly overland flow (Semmens et al. 2005) • Event-based (1-minute time step) • Distributed, physically-based model with dynamic routing • Hydrology, erosion, sediment transport • Smaller watersheds (< 100 km2) Abstract Routing Representation 71 72 73 74
Resolution 25m Extracted from 1:50000 topographical map CORINE Land Cover Based on Landsat images 1990 and 2000 Clipped from FAO Soils World Map Daily rainfall Mean daily temperatures Daily river discharge MATERIALS • Digital Elevation Model (DEM) • Land Cover grid • FAO Soils map • Hydro-climatic information
Flow accumulation grid DEM 50m Flow direction grid Basin outlined MODELING • Watershed delineation • Land Cover and Soil parameterization • Generation of precipitation files • Run model and write output files
SWAT CALIBRATION Correlation coefficient observed/modeled runoff year month Karanzi 0.78 0.68 V. Turnovo 0.91 0.86 Gabrovo 0.89 0.85 Karanzi Veliko Turnovo Gabrovo
SWAT CALIBRATION Veliko Turnovo calibrated runoff monthly values - 1991
STRUCTURE OF THE PRESENTATION • Study area • Materials and methods • Results • Conclusions
LAND USE CHANGES CORINE Land Cover changes 1990-2000
LAND USE CHANGES Changes in the landscape types according tothe information from Bulgarian Inquiry for Observation of Agriculture and Economic Conjuncture (BIOAEC)
2. Optimistic 3. Pessimistic SCENARIOS DEVELOPMENT 1. Business as usual
Runoff change according to scenarios for particular flood events
STRUCTURE OF THE PRESENTATION • Study area • Materials and methods • Results • Conclusions
CONCLUSIONS • Yantra basin has relatively high natural hazard pressure • Floods and torrential rains have the biggest part • The complex hazard loading is unequally distributed • The highest values are observed in LT3 and LT4 • The lowest values are observed I LT1 • The land cover changes detected in the basin could be • used to make future scenarios • Land Cover changes have significant effect on the • discharge and consequently on the floods hazard • The increase of natural vegetation areas reduces the hazard • More agriculture and barren lands increase the hazard
CONCLUSIONS • The application of AGWA gives the opportunity to • evaluate the influence of Land Cover changes • AGWA could be used to assess the pressure exerted by • future human activities in the basin • The effective application of SWAT and KINEROS needs • further calibration, adjustment and validation • The models were run using the minimum of required data • More precise results would be obtained using additional data i.e. • wgn, hydraulic geometry and climatic data
The authors are very grateful to Darius Semmens from the US EPA – Las Vegas for the practical help ACKNOWLEDGEMENTS The hydroclimatic data and DEM were provided by REKA project sponsored by U.S. National Science Foundation with principal investigators Gregory Knight and Todor Hristov