River Basin Modeling
River Basin Modeling. Water Resources Planning and Management Daene C. McKinney. Water Resources. Water at: Wrong place, wrong quantity, wrong time What to do? Manipulate the hydrologic cycle Build facilities? Remove facilities? Reoperate facilities? Reservoirs Canals Levees

River Basin Modeling
E N D
Presentation Transcript
River Basin Modeling Water Resources Planning and Management Daene C. McKinney
Water Resources • Water at: • Wrong place, wrong quantity, wrong time • What to do? • Manipulate the hydrologic cycle • Build facilities? Remove facilities? Reoperate facilities? • Reservoirs • Canals • Levees • Other infrastructure
Scales Time Scales • Water management plans • Consider average conditions within discrete time periods • Weekly, monthly or seasonal • Over a long time horizon • Year, decade, century • Shortest time period • No less than travel time from the upper basin to mouth • For shorter time periods some kind of flow routing required • Flood management • Conditions over much shorter periods • Hours, Days, Week
Processes • Processes we need to describe: • Precipitation • Runoff • Infiltration • Percolation • Evapotranspiration • Chemical concentration • Groundwater
Data • Reservoir losses • Missing data • Precipitation-runoff models • Stochastic streamflow models • Extending and filling in historic records • Measurement • Data sources • Flow conditions • Natural • Present • Unregulated • Regulated • Future
Yield • Yield - amount of water that can be supplied during some time interval • Firm yield - amount of water that can be supplied in a critical period • Without storage: firm yield is lowest streamflow on record, • With storage: firm yield can be increased to approximately the mean annual flow of stream
Regulation and Storage • Critical period - period of lowest flow on record • “having observed an event in past, it is possible to experience it again in future” • Storage must be provided to deliver additional water over total streamflow record • Given target yield, required capacity depends on risk that yield will not be delivered, i.e., the reliability of the system
Hydrologic Frequency Analysis • Flow duration curves • Percent of time during which specified flow rates are equaled or exceeded at a given location Pr{ Q > q }
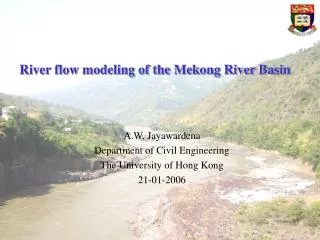
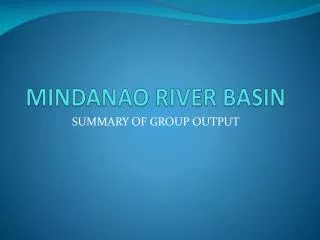
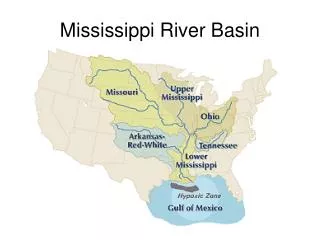
Central Asia Syr Darya Naryn River
Naryn River Annual Flows Median flow Min. flow Glacier melt
Random Variables • Function (X) whose value (x) depends on the outcome of a chance event • Discrete RV • Takes on values from a discrete set # of years until a certain flood stage returns # of times reservoir storage drops below a level • Continuous RV • Takes on values from a continuous set e.g., Rainfall, Streamflow, Temperature, Concentration
Cumulative Distribution Function Continuous RV Discrete RV
Probability Density (Mass) Functions Probability density function Probability mass function Continuous RV Discrete RV
Multiple RVs • The joint distribution of two RVs, X and Y: • For example, joint distribution of current streamflow and previous streamflow
Independent RVs • If the distribution of RV X is not influenced by the value taken by RV Y, and vice versa, the RVs are independent • For two independent RVs, the joint probability is the product of the separate probabilities.
Marginal Distributions • Two RVs X and Y can have a joint distribution • The marginal distribution of Xis the distribution of X ignoring Y
Conditional Distributions • Conditional distribution of Xgiven that Y has taken on a particular value
Discrete RVs • Conditional Distribution • Joint Distribution • Marginal Distribution
Expectation Note (expected value of X – Mean of X)
Principle • Replacement of uncertain quantities by either expected, median or worst-case values can grossly affect the evaluation of project performance when important parameters are highly variable.
Qt K St Rt Example • Elevation of reservoir water surface varies from year to year depending on the inflow and demand for water.
Example • Average pool level • Average Visitation Rate
FX(x) p xp X Quantiles • X is a continuous RV • p-thquantile is xp • Median: x50 • equally likely to be above as below that value • Interquartile range: [x0.25, x0.75] • range of values that the random variable might assume • Examples • Floodplain management - the 100-year flood x0.99 • Water quality management - minimum 7-day-average low flow expected once in 10 years: 10th percentile of the distribution of the annual minima of the 7-day average flows
Quantiles • Observed values, sample of size n • Order statistics (observations ordered by magnitude • Sample estimates of quantiles can be obtained by using
Flow Duration Curve • Flow duration curve - Discharge vs % of time flow is equaled or exceeded. • Firm yield is flow that is equaled or exceeded 100% of the time
Increase Firm Yield - Add storage • To increase the firm yield of a stream, impoundments are built. Need to develop the storage-yield relationship for a river • Simplified methods • Mass curve (Rippl) method • Sequent peak method • More complex methods • Optimization • Simulation
Simplified Methods • Mass curve (Rippl) method • Graphical estimate of storage required to supply given yield • Constructed by summing inflows over period of record and plotting these versus time and comparing to demands • Time interval includes “critical period” • Time over which flows reached a minimum • Causes the greatest drawdown of reservoir
Qt Rt Rippl Method Accumulated Inflows, Q Capacity K Accumulated Releases, R