Download
1 / 1
10 likes | 81 Vues
"Exploring the effects of density and temperature perturbations during the era before the first galaxies, considering factors like gravitational forces, electron scattering, and gas pressure. Precise calculations are crucial for understanding galaxy formation and can be observed through cosmological 21cm fluctuations. The power spectra of fluctuations are analyzed at varying redshifts, revealing the intricate interplay of baryonic and dark matter densities. Spatial sound speed fluctuations induce significant changes in baryonic power spectra, impacting the evolution of large and small-scale perturbations."

E N D
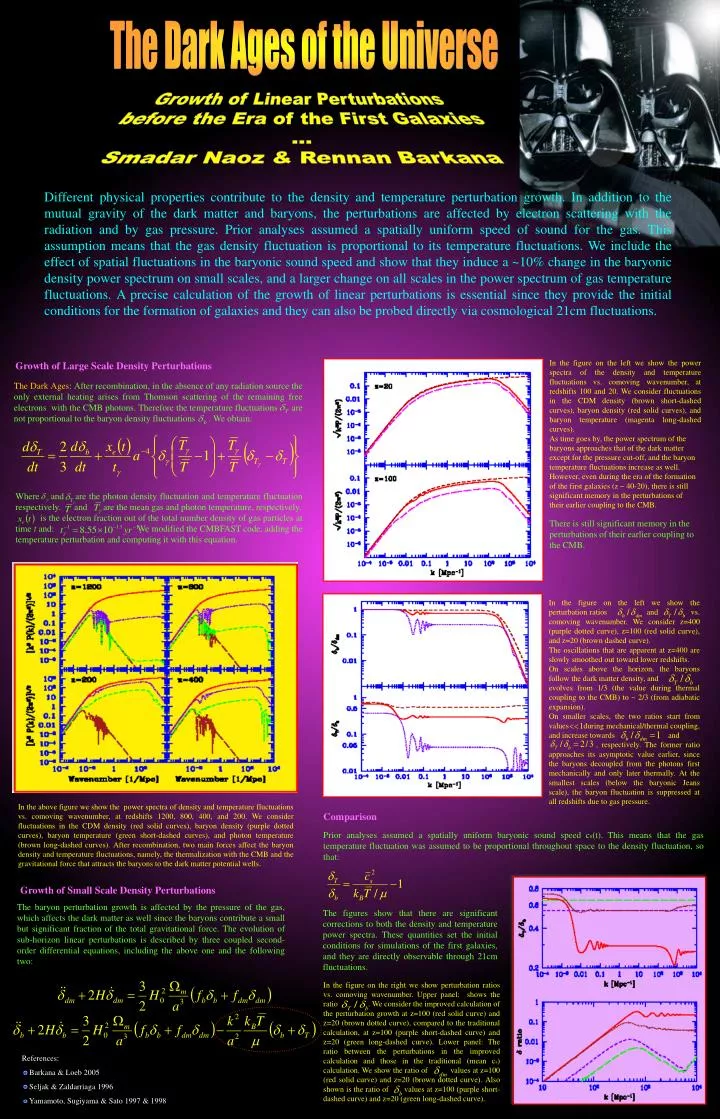
The Dark Ages: After recombination, in the absence of any radiation source the only external heating arises from Thomson scattering of the remaining free electrons with the CMB photons. Therefore the temperature fluctuations are not proportional to the baryon density fluctuations . We obtain: Where and are the photon density fluctuation and temperature fluctuation respectively. and are the mean gas and photon temperature, respectively. is the electron fraction out of the total number density of gas particles at time t and: We modified the CMBFAST code, adding the temperature perturbation and computing it with this equation. In the figure on the right we show perturbation ratios vs. comoving wavenumber. Upper panel: shows the ratio . We consider the improved calculation of the perturbation growth at z=100 (red solid curve) and z=20 (brown dotted curve), compared to the traditional calculation, at z=100 (purple short-dashed curve) and z=20 (green long-dashed curve). Lower panel: The ratio between the perturbations in the improved calculation and those in the traditional (mean cs) calculation. We show the ratio of values at z=100 (red solid curve) and z=20 (brown dotted curve). Also shown is the ratio of values at z=100 (purple short-dashed curve) and z=20 (green long-dashed curve). The Dark Ages of the Universe Growth of Linear Perturbations before the Era of the First Galaxies ... Smadar Naoz & Rennan Barkana Different physical properties contribute to the density and temperature perturbation growth. In addition to the mutual gravity of the dark matter and baryons, the perturbations are affected by electron scattering with the radiation and by gas pressure. Prior analyses assumed a spatially uniform speed of sound for the gas. This assumption means that the gas density fluctuation is proportional to its temperature fluctuations. We include the effect of spatial fluctuations in the baryonic sound speed and show that they induce a ~10% change in the baryonic density power spectrum on small scales, and a larger change on all scales in the power spectrum of gas temperature fluctuations. A precise calculation of the growth of linear perturbations is essential since they provide the initial conditions for the formation of galaxies and they can also be probed directly via cosmological 21cm fluctuations. In the figure on the left we show the power spectra of the density and temperature fluctuations vs. comoving wavenumber, at redshifts 100 and 20. We consider fluctuations in the CDM density (brown short-dashed curves), baryon density (red solid curves), and baryon temperature (magenta long-dashed curves). As time goes by, the power spectrum of the baryons approaches that of the dark matter except for the pressure cut-off, and the baryon temperature fluctuations increase as well. However, even during the era of the formation of the first galaxies (z ~ 40-20), there is still significant memory in the perturbations of their earlier coupling to the CMB. Growth of Large Scale Density Perturbations There is still significant memory in the perturbations of their earlier coupling to the CMB. In the figure on the left we show the perturbation ratios and vs. comoving wavenumber. We consider z=400 (purple dotted curve), z=100 (red solid curve), and z=20 (brown dashed curve). The oscillations that are apparent at z=400 are slowly smoothed out toward lower redshifts. On scales above the horizon, the baryons follow the dark matter density, and evolves from 1/3 (the value during thermal coupling to the CMB) to ~ 2/3 (from adiabatic expansion). On smaller scales, the two ratios start from values during mechanical/thermal coupling, and increase towards and , respectively. The former ratio approaches its asymptotic value earlier, since the baryons decoupled from the photons first mechanically and only later thermally. At the smallest scales (below the baryonic Jeans scale), the baryon fluctuation is suppressed at all redshifts due to gas pressure. In the above figure we show the power spectra of density and temperature fluctuations vs. comoving wavenumber, at redshifts 1200, 800, 400, and 200. We consider fluctuations in the CDM density (red solid curves), baryon density (purple dotted curves), baryon temperature (green short-dashed curves), and photon temperature (brown long-dashed curves). After recombination, two main forces affect the baryon density and temperature fluctuations, namely, the thermalization with the CMB and the gravitational force that attracts the baryons to the dark matter potential wells. Comparison Prior analyses assumed a spatially uniform baryonic sound speedcs(t).This means that the gas temperature fluctuation was assumed to be proportional throughout space to the density fluctuation, so that: Growth of Small Scale Density Perturbations The baryon perturbation growth is affected by the pressure of the gas, which affects the dark matter as well since the baryons contribute a small but significant fraction of the total gravitational force. The evolution of sub-horizon linear perturbations is described by three coupled second-order differential equations, including the above one and the following two: The figures show that there are significant corrections to both the density and temperature power spectra. These quantities set the initial conditions for simulations of the first galaxies, and they are directly observable through 21cm fluctuations. References: Barkana & Loeb 2005 Seljak & Zaldarriaga 1996 Yamamoto, Sugiyama & Sato 1997 & 1998