Download
1 / 1
10 likes | 121 Vues
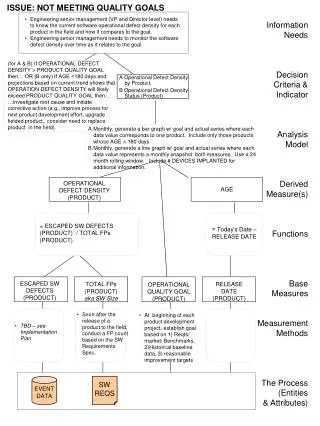
ISSUE: NOT MEETING QUALITY GOALS. Engineering senior management (VP and Director level) needs to know the current software operational defect density for each product in the field and how it compares to the goal.

E N D
ISSUE: NOT MEETING QUALITY GOALS • Engineering senior management (VP and Director level) needs to know the current software operational defect density for each product in the field and how it compares to the goal. • Engineering senior management needs to monitor the software defect density over time as it relates to the goal. Information Needs Decision Criteria & Indicator Analysis Model Derived Measure(s) Functions Base Measures Measurement Methods The Process (Entities & Attributes) (for A & B) If OPERATIONAL DEFECT DENSITY > PRODUCT QUALITY GOAL then… OR (B only) If AGE <180 days and projections based on current trend shows that OPERATION DEFECT DENSITY will likely exceed PRODUCT QUALITY GOAL then… …investigate root cause and initiate corrective action (e.g., improve process for next product development effort, upgrade fielded product,, consider need to replace product in the field). A Operational Defect Density by Product, B Operational Defect Density Status (Product) • Monthly, generate a bar graph w/ goal and actual series where each data value corresponds to one product. Include only those products whose AGE > 180 days • Monthly, generate a line graph w/ goal and actual series where each data value represents a monthly snapshot both measures. Use a 24 month rolling window. Include # DEVICES IMPLANTED for additional information. OPERATIONAL DEFECT DENSITY (PRODUCT) AGE = ESCAPED SW DEFECTS (PRODUCT) / TOTAL FPs (PRODUCT) = Today’s Date – RELEASE DATE ESCAPED SW DEFECTS (PRODUCT) RELEASE DATE (PRODUCT) TOTAL FPs (PRODUCT) aka SW Size OPERATIONAL QUALITY GOAL (PRODUCT) • Soon after the release of a product to the field, conduct a FP count based on the SW Requirements Spec. • At beginning of each product development project, establish goal based on 1) Reqts/ market/ Benchmarks, 2)Historical baseline data, 3) reasonable improvement targets • TBD – see Implementation Plan EVENT DATA SW REQS