The Global Economy Introduction
810 likes | 1.15k Vues
The Global Economy Introduction. Roadmap. News this week Trends Trade Fluctuations Inflation and output Course information. What is happening this week?. Try to touch on in each class The Economist o r FT Order now if you haven ’ t already Interesting articles, anecdotes?.

The Global Economy Introduction
E N D
Presentation Transcript
Roadmap • News this week • Trends • Trade • Fluctuations • Inflation and output • Course information
What is happening this week? • Try to touch on in each class • The Economist or FT • Order now if you haven’t already • Interesting articles, anecdotes?
What is happening? • Week of September 19 • FOMC meeting • Existing Home Sales • Leading Indicators • Week of September 26 • New Home Sales • S&P Case-Shiller House Prices • Consumer Confidence • Durable Goods Orders • 2Q Corporate Profits and Revised GDP • Personal Income and Consumption • Reuters/Michigan Sentiment
FOMC StatementAugust 9, 2010 “The Committee currently anticipates that economic conditions – including low rates of resource utilization and a subdued outlook for inflation over the medium run – are likely to warrant exceptionally low levels for the federal funds rate at least through mid-2013. […] The Committee will regularly review the size and composition of its securities holdings and is prepared to adjust those holdings as appropriate.”
Class participation • Important part of class • I expect everyone to participate • Answer a question, make a comment, share an experience • Post to Bb discussion (see handout) • Broad range of backgrounds • Expert: keep it short • Non-expert: don’t panic
Roadmap • News this week • Trends • Trade in goods and services • Fluctuations • Inflation and output • Course information
Long-Run Performance Production, Saving &Investment, Productivity, Institutions, Capital & Labor Markets, International Trade First half: Short-Run Performance Inflation, Economic Indicators, Aggregate Supply & Demand, Monetary Policy, Taxes & Deficits, Exchange Rates, Capital Flows, Emerging Market Crises Second half: The big picture
Long run: GDP per capita Source: Penn World Tables 7.0.
The wealth of nations • GDP per capita is more than 100 times larger in US than Burundi. • What can explain such enormous differences?
Long-run Economic GrowthGDP per capita in Year 2000 international dollars Source: Maddison, 2001; 2008 estimate based on Maddison tables.
Trends are important Source: Maddison, “Historical Statistics for the World Economy”
Do Institutions Matter?Control of Corruption U.S. India Note: Size of circle is proportional to population. Data sources: World Bank and Transparency International.
Do Institutions Matter?Index of Contractual Freedom U.S. China Note: Size of circle is proportional to population. Data sources: World Bank and Heritage Foundation.
Do entrepreneurs matter? Source: U.S. Census.
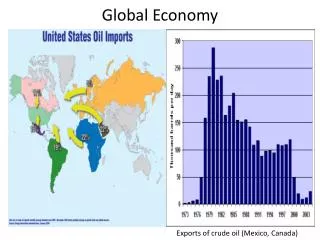
How do trade patterns evolve? • Who are the U.S.’s largest trade partners? • What good is most traded? (value-wise) • How are trade patterns changing? • Why are they changing?
US imports Canada Japan Mexico China
US exports Canada Mexico Japan China
Business cycles Source: Congressional Budget Office.
About the course • Main data sources • Blackboard • Syllabus: on Bb • Announcements: on Bb • Course by session: on Bb
About class notes • No textbook! • Theoretical background to class discussion • Executive summaries: more concise than a textbook • Custom designed for this course • Read them before class
About Graded Assignments Four graded problem sets Individual submission of work Your own words Your own calculations List anyone in class with whom you worked (groups of up to four persons permitted) Submit via BB homework dropbox
Discussion Board A way to Participate Keep up on current issues Once during the semester, you will post a “lead” comment Details in handout
About help! • Email me (kschoenh@stern.nyu.edu) • Or contact the teaching assistant • Samantha Azzarello (sa1777@nyu.edu)
About helping me • Course works best if communication goes both ways • If you have ideas, comments, questions, whatever: • Send an email • Speak to the teaching assistant • Post on the discussion board
What have we learned today? As Haiku: read notes before class if you need help ask for it Blackboard is knowledge
Roadmap • Headline Data • Gross Domestic Product (GDP) • Inflation • How are they measured? • What are the basic facts? • Why care about GDP?
Why worry about measurement? • Need a common vocabulary • Small changes in definition make big differences • Accurate forecasting requires consistent measurements
GDP per capita (PPP adj, 2005 USD) Source: PWT 7.0.
Growth of GDP (forecast for 2012, in 2011) Source: OECD Economic Outlook, September 2011.
GDP • GDP = Gross Domestic Product • Total value of production in an economy • Sum of value-added by production units • Equals: • payments to labor and capital (owners) • sales of final goods • (almost) income
GDP identities Farmer Sales = $10 Farm Rent = $3 Net Income = $7 Value Added =?? Brewer Sales = $110 Factory Rent = $30 Wages = $70 Barley = $10 Value Added =?? Landlord’s income +wages + profits = ?? Value added farming + value added brewing = ?? Final production farming + final production brewing = ??