Five-step model for Testing Hypotheses
Five-step model for Testing Hypotheses. The five-step model used for all hypothesis tests contains the following steps: Step 1. Evaluating assumptions. Step 2. Stating the research hypothesis and the null hypothesis and setting alpha

Five-step model for Testing Hypotheses
E N D
Presentation Transcript
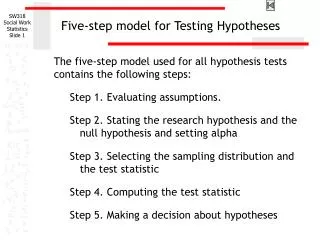
Five-step model for Testing Hypotheses The five-step model used for all hypothesis tests contains the following steps: Step 1. Evaluating assumptions. Step 2. Stating the research hypothesis and the null hypothesis and setting alpha Step 3. Selecting the sampling distribution and the test statistic Step 4. Computing the test statistic Step 5. Making a decision about hypotheses
Evaluating Assumptions • All hypothesis tests assume the sample is representative of the population – assured by random sampling • Assumptions about the distribution of variables. e.g. normality, equal variances • Assumptions about sample size, e.g. no cell with expected frequency less than 5
Hypotheses • The research hypothesis states relationship we think is true, e.g. mean of one group higher than other, or two variables are related • The null hypothesis contradicts research hypothesis, e.g. means of all groups are the same, or two variables are independent. Usually a statement of equality or no difference. • Both hypotheses are statements about the population that will be tested on sample data.
Alpha • Alpha is the probability that we could make an error in rejecting the null hypothesis and supporting the research hypothesis. • Alpha is the risk that we will make a Type I error – a true null hypothesis is rejected. • We can also make an error when the null hypothesis is false, but we fail to reject it – a Type II error. • When alpha is higher, it is easier to reject the null hypothesis and the chances that we may be making a mistake are larger.
Alpha • We choose alpha based on the consequences of making a Type I error or a Type II error. • If rejection of null hypothesis leads to action with serious side effects, we set alpha lower (making it harder to reject null) so that we do not risk the side effects too easily. Type I error is less likely. • If rejection of the null hypothesis lead to an action that may be helpful and has no serious side effects, we set alpha higher (making it easier to reject null) so that we take advantage of helpful action. Type II error is more likely.
Selecting Test Statistic • We choose the statistical test based on the research question and the conformity of the variables to the assumptions for the test. • First, we eliminate statistical tests for which we cannot satisfy the level of measurement requirements and other assumptions. • Second, we choose the statistical test that treats the variables at the higher level of measurement. For example, we could test the relationship between two ordinal variables with either regression analysis or with a chi-square test of independence. We would choose the regression analysis, because the variables are treated as interval rather than nominal.
Making a decision based on test statistic • If the p-value of the test statistic is less than or equal to alpha, we reject the null hypothesis and find that our research hypothesis is supported.
Testing Hypotheses: Sampling Distribution and Test Statistic
Testing Hypotheses: Post Hoc Tests • Chi-square test of independence supports the existence of relationship between variables. It does not tell us about strength or direction of relationship, i.e. which cells produce the difference. For this we use post hoc test of standardized residuals. • One-way ANOVA identifies that one or means are different, but does not indicate pattern of differences between groups. To identify which means are different from one another, we use a post hoc test, such as Tukey HSD test.