Download
1 / 31
320 likes | 440 Vues
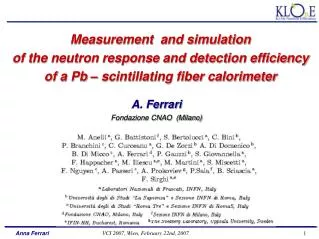
Measurement and simulation of the neutron response and detection efficiency of a Pb – scintillating fiber calorimeter. A. Ferrari Fondazione CNAO (Milano). The KLOE Pb-scintillating fiber calorimeter. Designed and put in operation as e.m. calorimeter. Active material :

E N D
Measurement and simulation of the neutron response and detection efficiency of a Pb – scintillating fiber calorimeter A. Ferrari Fondazione CNAO (Milano)
The KLOE Pb-scintillating fiber calorimeter Designed and put in operation as e.m. calorimeter Active material: • 1.0 mmdiameter scintillating fiber (Kuraray SCSF-81, Pol.Hi.Tech 0046), emitting in the blue-green region: lPeak~ 460 nm. • Core: polystyrene, r=1.050 g/cm3, n=1.6 High sampling structure: • 200 layers of 0.5 mm grooved lead foils (95% Pb and 5% Bi). • Glue: Bicron BC-600ML, 72% epoxy resin, 28% hardener. • Lead:Fiber:Glue volume ratio = 42:48:10 1.0 mm 1.2 mm 1.35 mm Good performance in time and energy response: s(E)/E = 5.7 %/√E(GeV)s(t)= 54 ps/√E(GeV) and high photon efficiency see NIMA 482 (2002) 364-386
Detection of neutrons of few to few hundreds of MeV is traditionally performed with organic scintillators (principle of operation: elastic neutron scattering on H atoms, with production of protons detected by the scintillator itself) efficiency scales with thickness ~1%/cm An estimate with KLOE data ( n are produced by K- interactions in the apparatus walls) gave: 40%for low energy neutrons (Ekin≤ 20 MeV), confirmed by KLOE MC (expected: 10%) - Measurement of the neutron e.m. form factors in the time-like region (DANTE) - Search for deeply bounded kaonic nuclei (AMADEUS) n are important for the DAFNE-2 program @ LNF • an intense Monte Carlo study has been performed with the FLUKA code, which is • well validated for the hadronic physics, till the low energy region • an experimental test has been carried out with the neutron beam of the The Svedberg Laboratory of Uppsala (October 2006) [with TARI program support] Why looking for neutron detection efficiency ? • On the other hand, the extended range rem counters used in radiation protection are based on a structure scintillator/medium-high Z material, which enhances the neutron efficiency seeC. Birattari, A.Ferrari, M.Pelliccioni et al., NIMA 297 (1990) 250-257, NIM A 338 (1994) 534-543
KLOE calorimeter module 5.31 m EKIN (MeV) The neutron beam line at TSL • A quasi-monoenergetic neutron beam is produced in the reaction 7Li(p,n)7Be. • 42% of neutrons at the max energy • The absolute neutron flux in the peak is measured after the collimator by 2 monitors of the beam intensity. Accuracy: ~ 10%
(3) Y X Z (2) n (1) The experimental setup and the data set last plane not integrated in the acquisition system ( 1 )Old prototype of the KLOE calorimeter: 60 cm long, 3 x 5 cells (4.2 x 4.2 cm2), read out at both ends by Hamamatsu/Burle PMTs ( 2 ) Beam position monitor: array of 7 scintillating counters, 1 cm thick. ( 3 ) Reference counter: NE110, 10×20 cm2, 5 cm thick A rotating frame allows for: - vertical positions (data taking with n beam) - horizontal positions (calibration with cosmic rays) • For each configuration, several scans with different trigger thresholds • Typical run: 0.5-1.5 Mevents, 1.7 kHz DAQ rate • Cosmic rays run (beam off) for calibrations with MIPs. • 3 large data sets collected with different beam intensities: 1.5 kHz/cm2, 3.0 kHz/cm2 and 6.0 kHz/cm2
RTRIGGER e = RNEUTRON× fLIVE× a The measurement of the global efficiency I. The method Global efficiency measurement integrated on the full spectrum RNEUTRON: from beam monitor via neutron flux intensity measured by TSL. RTRIGGER: use coincidence between sides. • Scintillator: T1 trig = Side 1×Side 2 • Calorimeter: use the analog sum of 12 PMs/side (first four planes) T1 trig = SA×SB fLIVE: live time fraction a: for preliminary measurement, assume full acceptance and no background
(%) Agreement within errors with previous published measurements in the same energy range, after a rescaling of them to our thickness Threshold (MeV e equiv. energy) II. The scintillator efficiency • The measurement of the scintillator efficiency gives a cross calibration of the measurement method and of the beam monitor accuracy, with small corrections due to the live time fraction • The energy scale was calibrated with a 90Sr b source. 10% accuracy for horizontal scale (threshold) and the vertical one (e) Results agree with “thumb rule” (1%/cm): 5% for 5 cm thick scintillator (with a threshold of 2.5 MeV electron equivalent energy)
Thr (MeV e equiv. energy) III. The calorimeter efficiency e (%) • Energy scale setting done by MIP calibration of all channels, and using the MIP/MeV scale factor used in KLOE • 10% uncertainty on both horizontal and vertical scales • Stability wrt very different run conditions: a factor 4 variations of both live time fraction (e.g. fLIVE=0.2 0.8) and beam intensity (1.5 6.0 kHz/cm2). Very high efficiency, about 4 times larger than the expected if only the amount of scintillator is taken into account: ~ 8% for 8 cm of scintillating fibers. Compare with our scintillator efficiency measurement, scaled by the scintillator ratio factor 8/5
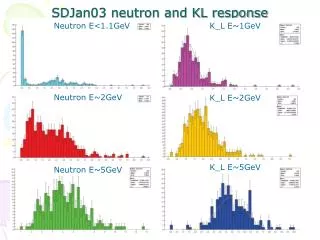
ToF (ns) n The neutron spectrum from ToF • Correct raw spectra for T0 and convert into ns • Since the trigger is phase locked with the RF ( time structure: 45 ns), rephasing is needed for neutrons with Ekin < 50 MeV (5.3 m far from the target) • From ToF spectrum obtain b of the neutron • Assuming neutron mass, obtain Ekin
Energy (MeV eq. el.) ToF (ns) threshold: 15 mV Energy (MeV eq. el.) Energy vs ToF • The collected charge is here expressed as the energy of an electron that gives the same charge response Energy released vs ToF Charge response
base module GLUE FIBERS replicas 200 layers The calorimeter simulation with FLUKA LEAD • Using the FLUKA tool LATTICE • the fiber structure of the whole calorimeter • module has been designed. • In the base module the calorimeter is simulated in detail, both under the geometrical point of view and with respect to the used materials • All the compounds have been carefully simulated. - for the fibers, an average density between cladding and core has been used : ρ = 1.044 g/cm3 • - glue: 72% epoxy resin C2H4O, r=1.14 g/cm3, • + 28% hardener, r=0.95 g/cm3 hardener composition
The readout simulation Fluka gives energy deposits in the fiber. The light is propagated by hand at the end of the fiber taking into account the attenuation. • The energy read-out has been simulated by including: • the generation of photoelectrons • the constant fraction distribution • the discriminator threshold. • No trigger simulation is included at the moment. The simulation of the Birks effect The energy deposits are computed in Fluka taking into account the Birks effect, that is the saturation of the light output of a scintillating materialwhen the energy release is high, due to the quenching interactions between the excited molecules along the path of incident particles: In literature and in GEANT: dL/dx = k dE/dx / [ 1 + c1 dE/dx + c2 (dE/dx)2] c1 = 0.013 c2 = 9.6×10⁻⁶
Li target 5.5° n Proton beam At the Li-target At the calorimeter Ekin(MeV) Y(cm) Shielding (concrete and steel) 7Li Target Calorimeter Z(cm) The simulation of the beam line • The beam line has been simulated starting from the neutrons out of the Litium target Gaussian angular distribution (Journal of Nuclear Science and Technology, supplement 2(2002), 112-115) At the entrance of the beam monitor
Typical reactions on lead:n Pb x n+y+Pbn Pbx n+y+p + residual nucleusn Pb x n+y+p + residual nucleus Neutron interactions in the calorimeter Simulated neutron beam: Ekin = 180 MeV Each primary neutron has a high probability to have elastic/inelastic scattering in Pb In average, secondaries generated in inelastic interactions are 5.4 per primary neutron,counting only neutrons above 19.6 MeV. In addition, secondaries created in interactions of low energy neutrons (below 19.6 MeV) are - in average - 97.7 particles per primary neutron.
X(cm) n4 n3 n p n2 n1 Z(cm) A typical inelastic process primary vertex En = 175.7 MeV En (p) = 126 MeV The enhancement of the efficiency appears to be due to the huge inelastic production of neutrons on the lead planes. These secondary neutrons:- are produced isotropically; - are produced with a non negligible fraction of e.m. energy and of protons, which can be detected in the nearby fibers; - have a lower energy and then a larger probability to do new interactions in the calorimeter with neutron/proton/γ production.
Neutron fluence F (E) X(cm) beam Ekin (MeV) Z(cm) dN/dΩ (n sr-1 per prim) cos(θ) Neutron yield inside the calorimeter Energy distribution 1° plane 4° plane Isotropic angular distributions from inelastic scattering
Proton fluence X(cm) beam Z(cm) F (E) dN/dΩ (prot sr-1 per prim) cos(θ) Ekin (MeV) The proton yield inside the calorimeter Protons are mainly concentrated along the direction of the primary beam Energy distribution Angular distribution
Zdeposit –Zprim.vert(cm) Xdeposit -Xprim.vert(cm) A key point: the high sampling frequency neutron lateral profile proton lateral profile Interaction vertex in lead (protons and res nuclei) The energy deposits of the ionizing particles (protons and excited nuclei) are distributed mainly in the nearby fibers:the high sampling frequency is crucial in optimizing the calorimeter
E(ril)/E(tot)(ril) Protons Neutrons E.m. energy Others Ekin (GeV) Particle contribution to the energy response Particle contribution to the energy released in the fibers: E(tot)(ril) = Σ Ep(ril) + Σ En(ril) + ΣEem(ril) + ΣEresnuc(ril) Evaluating the particle contribution to the energy response, we have to take into account: - the contribution of the highly ionizing particles: protons and excited nuclei; - the contribution of the e.m. energy The neutron contribution is not to take into account in general, because the neutrons transfer energy to the nuclei of the fibers basically as invisible energy. We don’t know if at least a part of this energy can produce somehow scintillating photons. For this reasons, we evaluate first the efficiency without taking into account the neutron energy deposits, then we do the exercise to re-calculate the efficiency also including the neutron contribution, as a superior limit to the true value.
ε (%) Preliminary Ekin (MeV) The simulated efficiency vs energy • No cut in released energy! • No trigger simulation • Simulation of the discriminator threshold applied only at the cell level not at the cluster level Integrated efficiency: 50% • By taking into account neutron energy deposits: ε ≈ 56% To be read as a superior limit !!
n Data vs Monte Carlo • The whole cluster algorithm procedure is under study • A first comparison at the cell level has been made (in this example: threshold = 15 mV) The agreement Data/MC is good, except for the lower energy region To be included in the simulation: local shielding, metallic supports, … to simulate the background due to the neutrons scattered on the materials in the experimental hall
ε(%) ε(%) Ekin(MeV) Ekin(MeV) n • Exp • Exp MC MC Tcell(ns) Tcell(ns) A study on the detection efficiency vs energy A fast Monte Carlo procedure has been used to test the sensitivity of the time distribution to the shape of the efficiency curve In this example: • two efficiency functions (Fermi-Dirac) are used in Monte carlo generation • time distributions for the central cell in the first plane are calculated and compared with the experimental data (threshold = 15 mV)
Conclusions • The first measurement of the detection efficiency of a high sampling • lead-scintillating fiber calorimeter to neutrons, in the kinetic energy range [20, 178] MeV • has been performed at The Svedberg Laboratory, Uppsala . • The efficiency integrated over the whole neutron energy spectrum ranges between • 40% and 50%, at the lowest trigger threshold used. • Adetailed Monte Carlo study, carried out with FLUKA, showed that that the origin of • a such enhancement is related both to an effect shower-like, due to the inelastic • processes in the Pb-scintillating fiber structure of the calorimeter, AND to the high sampling fraction used of this detector. • A first comparison Data/Monte Carlo has been done and is satisfactory. Work is in progress to tune the Monte Carlo. • New tests on neutron beam in different energy regions are in program We think that this work is the starting point for the study and the development of a new, compact, cheap, fast and efficient neutron detector
T2/T1FREE Thr (mV) Details on DAQ • Scintillator trigger: Side 1 – Side 2 coincidence (T1=S1×S2) • Calorimeter trigger: based on analog sum of the signals of the first 4 plan out of 5 (T1=A×B). • Trigger signal is phase locked with RF signal (T1 free). • Vetoed from retriggering by a 5-35 ms busy signal and by the DAQ busy. • The final trigger signal is: T2 = T1free.AND.NOT(BUSY). • T1free, T2, and the n monitor signals are acquired by a scaler asynchronous from DAQ. • Fraction of live time: T2/T1free; essential for the efficiency evaluation. • Neutron rate proportional to neutron monitor via neutron flux intensity (I0) and peak fraction (fP) • An absolute rate calibration should be provided by scintillator counter. • Calorimeter scintillator efficiency rate is almost independent from beam monitor.
40 ns Time structure RF Macro structure 2.4 ms Calorimeter Trigger signal 4.2 ms 5 ns FWHM 41 ns
Test of phase locking Beam RF T1(Free) Test done with a random trigger at 60KHz
Scintillator calibration Trigger threshold calibration: mV to ADC counts b source to set the energy scale in MeV: 90Sr b endpoint 0.564 MeV; 90Y b endpoint 2.238 MeV. Fit of the b spectrum, with ADC counts to MeV factor as a free parameter. S1(ADC counts) 1.15 count/mV S1 0.021 MeV/count Thr (mV) ADC counts
Calorimeter calibration • Cell response equalized: MIP peak at 600 ADC counts. • Trigger threshold calibration: - HP attenuators used for SA and SB not to exceed the dynamic range of the ADC; different attenuation factors: fA=2.0, fB=1.7. - Threshold in counts studied with different methods. • Energy scale set with MIPs using the conversion factor from KLOE: a MIP in a calorimeter cell corresponds to an electron of 35 MeV. A 1.6 count/mV B 2.0 count/mV ADC counts mV
100 mV 40 mV 15 mV TOF distributions with different trigger thresholds
Simulation of the energy read-out fiber (active material) The light is propagated by hand at the end of the fiber using the parametrization: energy deposit given by FLUKA Ea,b(fib) = E(dep) ·[0.35 e-x(a,b)/50 + (1- 0.35) e–x(a,b)/430 ] Kuraray Attenuation Ea,b(fib) = E(dep) ·[0.35 e-x(a,b)/50 + (1- 0.35) e–x(a,b)/330 ] Politech ta,b(fib) = t(dep) + X(a,b) /17.09 The number of photoelectrons generated by the light collected by each fiber is evaluated: t(a,b)(p.e.) = t(a,b)(fib)+ tscin+ 1ns(smearing) na,b(pe-fib) =E(fib)(MeV)(a,b) · 25 na,b(pe-cell) = ∑ t(pe)<300ns generated according to a Poisson distribution the constant fraction distribution is simulated (15% fr., 10 ns t.w.) to obtain the time