Download
1 / 16
170 likes | 206 Vues
Discover the history and workings of cosmic ray neutron monitors from the late 1940s to modern advancements. Explore their role in space science and solar modulation effects.

E N D
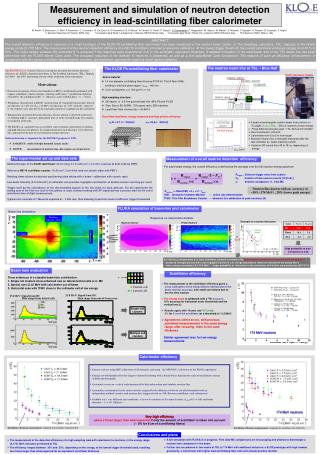
Neutron Monitor Detection Efficiency 2004 Annual CRONUS Collaboration Meeting John Clem University of Delaware
During the late 1940s John Simpson discovered that the latitude dependence of nucleonic intensity in the atmosphere is many times that of the ionizing component. The realization of this discovery gave him the inspiration to invent the cosmic ray neutron monitor that could better exploit the geomagnetic field as a magnetic spectrometer. By 1951 Simpson had set up five monitoring stations (the first neutron monitor network) from the city of Chicago to the magnetic equator in Peru, allowing him to use the Earth's own magnetic field as an analyzer. In 1954 and 1955 a sea-level survey by Rose et al., verified experimentally that the neutron monitor responded to lower energy primary cosmic rays than a muon monitor. By 1957-1958 (International Geophysical Year) the neutron monitor network expanded world wide to 50 stations. In 1964 the IGY network was supplemented with a second generation of Neutron Monitors which had a much higher count rate called the NM64 while the original design is called the IGY monitor.
Substantial contribution to space science was made by this early data. One of these is the discovery of solar modulation which is the influence the Sun exerts upon the intensity of galactic cosmic rays. When the sun is active, we get fewer cosmic rays here. As solar activity rises (top panel), the count rate recorded by a neutron monitor in McMurdo Antarctica decreases. But how does a Neutron Monitor work ?? What does it detect ??
The process begins in space with primary galactic cosmic rays entering the atmosphere after passing through the heliosphere (solar modulation) and geomagnetic field (rigidity cutoff). Most of these primaries are energetic enough to produce a nuclear or high energy interaction initiating a cascade of particles through the atmosphere. As the ensemble of cascades develop the particle density and the particle type distribution varies with atmospheric depth as shown in the Figure. The passage of each particle type through atmosphere is determined by different interaction channels. The dominate interaction depends on particle type, energy and material. Above energies of 100MeV muons are the dominate species at sea-level, however when considering all energies neutrons dominate in numbers. The question remains, how does the Neutron Monitor respond to this particles ??
In a neutron monitor, neutron sensitive proportional tubes, surrounded by moderator material and a lead target, detect thermal neutrons produced locally from interacting incident particles. Even though neutrons do not leave an ion trail in the proportional tube, the absorption of a neutron by a nucleus is usually followed by the emission of charge particles which can be detected. A proportional tube filled with either 10BF3 or 3He gas respond to neutrons by the exothermic reaction 10B(n,α)7Li or 3He(n,p)3H. The reaction cross-sections for both nuclei is inversely proportional to the neutron speed, having a thermal endpoint (0.025eV) of roughly 3840 barns and 5330 barns respectively, as shown in the Figure.
Surrounding each counter is a Moderatorwhich serves to reduce the energy of neutrons, thus increasing the probability of an absorption inside the counter while also providing a reflecting medium for low energy neutrons. Due to conservation of momentum, the neutron energy loss per elastic collision increases with decreasing atomic mass A, therefore materials with a high concentration of hydrogen are most effective. The moderator material used in NMs are either Low Density Polyethelene (NM64) or Paraffin (IGY).
The Lead Producer, which surrounds the moderator, provides a thick large-nucleus target for incident particles . A large nucleus such as lead is preferred as the neutron production rate per unit mass of a material is roughly proportional to A0.7. Inelastic interactions can separated into 2 stages: 1) Knock on phase: High energy nucleons, fragments, mesons, typically escape detection, but sometimes produce additional inelastic interactions 2) De-excitation phase: Wounded target nucleus ejects neutrons spectrum peaked near 1.0~MeV (evaporation neutrons). Source of counts in the proportional tubes. Low neutron capture cross-sections are also a required characteristic of the produce
Surrounding the lead is an outer moderator, usually referred to as to the Reflector, which serves to contain low energy neutrons produced in interactions within the lead as well as rejecting unwanted low energy neutrons (external evaporation neutrons) produced in the local surroundings from entering into the detector. Same material as used in the moderator tubes.
To determine the neutron monitor detection response a simulation was performed using a transport package entitled FLUKA combined with programs written by the author to simulate the proportional tube and electronics response to energy deposition in the gas. The standard dimensions and composition of materials of a IGY and a NM-64 were used as input to the geometry. 4 meter diameter parallel beam of mono-energetic particles at a fixed angle fully illuminates the neutron monitor as shown in the illustration, and is repeated for different incident beam angles, initial energy and particle species. Event1 Event2 1GeV Neutron simulated event examples
The resulting detection efficiency of a NM-64 for 6 different particle species including neutrons, protons, positive and negative pions and muons for vertical incident direction. It quite clear from this figure that the detector's response is optimized to measure the hadronic component as muons above 1 GeV is more 3 orders of magnitude less than the hadrons. In this energy region, muon generated counts is from neutron production in photo-nuclear interactions and from electromagnetic showers producing multiple ionization tracks in the counter. Energies below 1GeV stopping negative charge muons (or pions) are captured by a lead nucleus into a mesic orbit and absorbed by a nucleus which de-excites of the nucleus through the emission of neutrons which is reflected in the rise in detection efficiency with decreasing energy.
A comparison of the calculated detection efficiency for a NM-64 and IGY with data (Shibata, et al. 1999) and a previous calculation (Hatton 1971). The solid circular symbols are laboratory measurements with a neutron beam on a NM-64. The dashed lines represent a calculation by Hatton (1971) while the solid lines are the results of this work. Black represents the NM-64 response to neutrons and protons while red represents the IGY response to neutrons and protons. Within the energy range of the measurement, the data is in fair agreement with both models which is coincidentally the only region of agreement of the two calculations as well as the region of peak response when folded with sea-level particle spectra.
Left: Particle Fluxes measured at Sea-Level as published by Allkofer and Grieder 1984. Right: The fluxes weighted by the NM64 detection efficiency (as displayed in previous slides).As shown the detection efficiency biases the energy spectrum of these particles. The detectable neutron spectrum is harder than the actual spectrum while the detectable muon spectrum is much softer with break at 1GeV. The suppression of protons at low energy is mainly due to ionization energy loss while the low energy suppression of neutrons is due to change in inelastic cross-sections, reduction in evaporation neutrons with lower energy (n-Pb) and the energy lost due to elastic collisions in the reflector.
High latitude and altitude balloon and spacecraft measurements of the rigidity spectra of primary cosmic ray protons (upper spectra) and Helium ions (lower spectra) above of the Earth’s atmosphere (points) and global fit to all the spectra (curves). Yield function spectra of NM-64 counts at sea level from vertical incident primary protons is shown (top line). The contribution from different secondary particle species are separated into different curves. As shown the dominating contribution is from neutrons (black line), however protons and negative muons provide a significant contribution above 5GV. NM Response Function is the product of the Primary cosmic ray spectrum and total NM yield function. Relative contribution of different secondary particle species to NM for a Sea-Level Latitude Survey The count rates from a NM is the integral of response function. Observations and models of two NM latitude surveys
We have recently augmented the electronics for our neutron monitor latitude survey so as to record the elapsed time (dT) between detected neutrons in each proportional tube Left; Distribution of the elapsed time dT (modulo 142 ms) between measured single tube counts for 14.2~GV cutoff rigidity (lower curve and data) and 0.01~GV cutoff rigidity (upper curve and data). The histograms represent the observed data. The curves represent simulated data. Right: The same data on a compressed scale illustrating the transition from correlated to uncorrelated counts.
The integral of dT distributions shown in previous slide as a function of the integral lower limit. The integral is the neutron monitor count rate when the dead time is the integral lower limit. The average number of counts in a 6 tube NM-64 calculated for different dead times.