Download
1 / 25
250 likes | 365 Vues
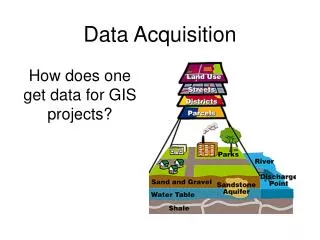
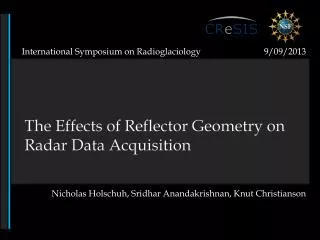
9/09/2013. International Symposium on Radioglaciology. The Effects of Reflector Geometry on Radar Data Acquisition. Nicholas Holschuh , Sridhar Anandakrishnan , Knut Christianson. Objectives of RES. Historic Objectives Determine the depth to (and geometry of) the basal reflector

E N D
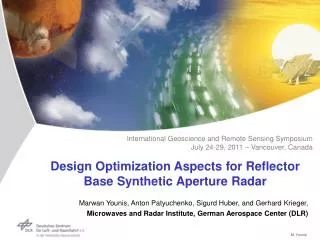
9/09/2013 International Symposium on Radioglaciology The Effects of Reflector Geometry on Radar Data Acquisition Nicholas Holschuh, Sridhar Anandakrishnan, Knut Christianson
Objectives of RES • Historic Objectives • Determine the depth to (and geometry of) the basal reflector • Describe the internal structure of the ice sheets using the internal reflecting horizons (IRHs) Introduction Refraction • Modern Objectives • Use return powers from basal reflectors to determine dielectric properties of the ice-bed interface • Analyze the spectral quality of reflectors to uniquely identify layers through space Stacking R. Pattern Conclusions
Motivation Introduction Refraction Stacking R. Pattern Conclusions
Motivation • The brightest reflectors are sometimes traceable through the lossy region Introduction • …but at other times, are completely lost in the noise… Refraction Stacking R. Pattern Conclusions
Motivation • What is the source of the data loss? • Affects deeper reflectors more than shallow ones • Appears to be related to reflector slope • More prevalent in the High Frequency Airborne Data Introduction Refraction Stacking R. Pattern Conclusions
Motivation Introduction Refraction Stacking R. Pattern Conclusions
Motivation Introduction Refraction Stacking R. Pattern Conclusions
Motivation Introduction Refraction Stacking R. Pattern Conclusions
Assumptions - Specularity Basal Reflectors: Diffuse Introduction Reflection Coefficient + Angular Distribution Internal Reflectors: Specular (Obey the Law of Reflection) Reflection Coefficient Refraction Stacking R. Pattern Conclusions
Beam Focusing n = 1 + 0.851ρ Introduction Airborne Survey Ground Survey Refraction Stacking R. Pattern Conclusions
Beam Focusing Introduction Ground Survey Airborne Survey Refraction Stacking Refraction Limits: Ground Survey – 49º Airborne Survey – 34º R. Pattern Conclusions
Stacking Introduction Refraction Stacking R. Pattern Component Traces Superimposed Components Ideal Stack (Normalized) Stacked Trace (Normalized) Conclusions
Stacking Introduction Refraction Stacking Stacking Controls Radar Frequency Reflector Dip Stacking Distance R. Pattern Component Traces Superimposed Components Stacked Trace (Normalized) Ideal Stack (Normalized) Conclusions
Stacking – 1m Posting Interval Introduction Refraction Stacking R. Pattern Conclusions
Stacking – 1m Posting Interval Introduction Refraction 0.863 Stacking R. Pattern Conclusions
Stacking – 10m Posting Interval Introduction Refraction 0.018 Stacking R. Pattern Conclusions
Stacking – 10m Posting Interval Introduction Refraction 0.202 Stacking R. Pattern Conclusions
Stacking – 20m Posting Interval Introduction Refraction 0.009 Stacking R. Pattern Conclusions
Stacking – 10m Posting Interval 1 0.0468 0.0195 0.0179 0.0021 0.0009 Introduction 1 0.0821 0.0302 0.0295 0.0224 0.0026 Refraction 1 0.0985 0.0479 0.0302 0.0252 0.0118 Stacking 1 0.2027 0.0985 0.0709 0.0405 0.0225 R. Pattern 1 0.997 0.9891 0.9768 0.9619 0.9462 Conclusions
Stacking Amplitude Loss Introduction Refraction Stacking R. Pattern Conclusions
Radiation Pattern Introduction Refraction Stacking R. Pattern Describes the angular distribution of the gain for a given radar antenna (Typically optimized for Nadir) Conclusions
Radiation Pattern Introduction Refraction Stacking R. Pattern Conclusions
Caveats - Specularity Offsets 0 – 1400m (100m) Introduction Transmitter Receiver Refraction Stacking R. Pattern Conclusions
Conclusions • Areas of intense deformation (and therefore glaciological interest) are prone to internal data loss • Amplitude loss due to reflector geometry should be corrected for if dipping beds are used in amplitude analysis. • Loss is ultimately a function of radar design and data collection methods. Choosing appropriate radars (frequency), platform, and stacking distances can minimize data loss. Introduction Refraction Stacking R. Pattern Conclusions
Nicholas Holschuh – ndh147@psu.edu Advisors: Sridhar Anandakrishnan Richard Alley Collaborator: Knut Christianson Introduction Refraction Questions? Stacking R. Pattern Conclusions We would like to acknowledge the use of data products from CReSIS generated with support from NSF grant ANT-0424589 and NASA grant NNX10AT68G. This material is based upon work supported by the National Science Foundation Graduate Research Fellowship Program under Grant No. DGE1255832.