1.3 Experimental Design
140 likes | 173 Vues
Explore various data collection methods in experimental design studies, from surveys to simulations, to interpret data accurately and avoid biases. Learn sampling techniques like random, systematic, and cluster sampling to ensure the validity of study results.

1.3 Experimental Design
E N D
Presentation Transcript
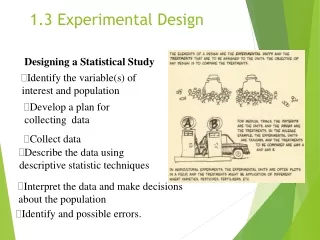
1.3 Experimental Design Designing a Statistical Study • Identify the variable(s) of interest and population • Develop a plan for collecting data • Collect data • Describe the data using descriptive statistic techniques • Interpret the data and make decisions about the population • Identify and possible errors.
Data CollectionSurvey! • Census: A census is a count or measure of an entire population. • Sampling: A sampling is a count or measure of part of a population. • Simulation: A simulation is the use of a mathematical or physical model to reproduce the conditions of a situation or process. • Perform an experiment When performing an experiment, a treatment is applied to part of a population and responses are observed. • Observational study: No cause and effect, you only observe what is happening.
Sampling Techniques • Random Sample - every member of the population has an equal chance of being selected. • Simple Random Sample (SRS) – a sample in which every possible sample of the same size has the same chance of being selected.(without replacement)
Stratified Sample members of the population are divided into two or more different subsets, called strata, that share a similar characteristic such as age, gender, ethnicity, etc • Cluster Sample - divide the population into groups, called clusters, and select all of the members in one or more (but not all) of the clusters.
Systematic Sample the members of the population are ordered in some way, a starting number is randomly selected, and then sample members are selected at regular intervals from the starting number
Voluntary Response Sample- Member of the population decide for themselves whether or not to respond • Convenience Sampling – Members of the population are chosen based on the convenience of including them • Quota Sampling – Interviewers are assigned to a fixed quota of members of the population. • Multi-stage Random Sample: repeated selections of simple random samples within prior simple samples.
Examples • What method of data collection would you use to collect data for a study where a drug was given to 10 patients and a placebo to another group of 10 patients to determine if the drug has an effect on a patient’s illness? a) Use sampling b) Use a simulation c) Take a census d) Perform an experiment Answer: d) perform an experiment • What method of data collection would you use to collect data for a study where you would like to determine the chance of getting three girls in a family of three children? • Use sampling b) Use simulation c) Take a census c) Perform an experiment Answer: b) Use a simulation
3)At a local community college, five statistics classes are randomly selected and all of the students from each class are interviewed. What sampling technique is used? • Cluster b) Random c) Convenience d) Systematic e) Stratified Answer: a) Cluster • A market researcher randomly selects 200 drivers under 30 years of age and 200 drivers over 30 years of age. What sampling technique was used? a) Cluster b) Random c) Convenience d) Systematic e) Stratified Answer: e) Stratified
Randomization The following table lists the heights in inches of all 80 of the 8th graders in a suburban middle school: Data value: ______________ 65 63 58 67 71 56 64 64 63 65 ______________ 66 70 51 55 57 64 63 69 59 60 ______________ 62 62 67 66 64 63 72 68 66 63 ______________ 62 65 56 59 66 68 62 61 58 59 ______________ 66 67 65 64 66 69 70 70 68 65 ______________ 63 65 67 68 69 69 71 72 55 58 ______________ 61 64 68 65 66 69 59 70 70 60 ______________ 60 65 68 67 63 61 58 68 65 69 a)Code each data value by its position in the lists. b)Perform a simple random sample of 10 heights from this population 3 times. Use the random digits table at least once and a calculator at least once! Random Digit Table: 34101 81277 66090 88872 37818 72142 67140 50785 21380 16703 53362 44940 60430 22834 14130 96593 23298 56203 92671 15925 82975 66158 84731 19436 55790 69229 28661 13675 99318 76873 54827 84673 22898 08094 14326 87038 42892 21127 30712 48489
Biases! Response Bias • The wording of the questions • The order of choices • The demeanor and/or appearance of the interviewer • Honesty Sampling Errors • Random Sampling Error occurs because of chance variation • Sampling Method Error can be due to the choice of sampling method • Non-sampling Method Error may occur in the responses by members in the sample. (Example is dishonest responses) Non-response Bias When members of the population are chosen but cannot be contacted. Household Bias Since most professional pollsters only interview one member of each household, there is a possibility that people who live in large household are underrepresented
Examples of Bias • Deliberate Bias – When an interviewer intentionally words a question to elicit the desired response. Ex: Do you agree that homeless animals should be euthanized instead of living a bleak and unloved existence in a cage? 2) Unintentional Bias: Wording a question in such a way that a large percent of the population could misinterpret the question. Ex: Do you think it is appropriate for two males to publicly show affection for each other?
3. Desire to Please/Social Acceptance: It has been found that (a) people tend to give the answer that he/she thinks the interviewer wants, and (b) people tend to give the most socially accepted answer even if it is not true. Ex: How often do you brush your teeth? • Everyday b) once a week c) before I go to the dentist 4. Asking the uninformed – People do not want to appear uninformed or ignorant so they answer questions for which they don’t know the answers. 5. Unnecessary Complexity – Sometimes survey questions are hard to read or are asking more than one question at a time. Ex: Do you sometimes find that you have arguments with your family members and coworkers?
6. Ordering of questions: Two related questions in a survey can change responses depending on which way they are ordered. 7.Anchoring: if a reference point (anchor is provide, people’s estimates tend to stay relatively close to that value. Ex: Northcraft and Neale (1987) conducted a study in which real estate agents were asked to give a recommended selling price for a home. They were given a ten-page packet about the property and spent 20 minutes walking through it. Contained in the ten-page packet was a listing price. To test the effect of anchoring, four different listing prices were given to different groups of agents, ranging from $119,900 to $149,900. The house had actually been appraised at $135,000. The four listing prices corresponding mean recommended selling price (RSP) were: Listing Price $119,900 $129,900 $139,900 $149,900 Mean RSP $117,745 $127,836 $128,530 $130,981 Ex: TV advertisement: “You might expect to pay $25, $30 or even more than this. But we are offering it for only $16.99.
Assignment On a white board, using the Questions Asked paper, write one biased question that represents a type of bias!